

Japanese Yen, USD/JPY, EUR/JPY, GBP/JPY Talking Points:
- The Yen-weakness theme continued in USD/JPY this week with price running up to resistance at 147.68 on Tuesday. As discussed in the Tuesday webinar, this was a key point of resistance, and could make chasing a challenge. I had also outlined support at 146.65 and that eventually came into play on Friday morning, but bulls reacted aggressively to push price right back up to 147.68 resistance.
- EUR/JPY and GBP/JPY, however, are showing a different story as both markets have put in indecision candles on the weekly chart over the past few weeks while stalling near long-term highs.
- I’ll be discussing these themes in-depth in the weekly webinar on Tuesday at 1PM ET. It’s free for all to register: Click here to register.
It was another week of strength for USD/JPY, even after the appearance of intervention threats from Japanese policymakers. Our own Matt Simpson covered this earlier today, highlighting Masato Kanda’s comment that came in on Wednesday in which the currency diplomat warned speculators that they would be watching moves in the FX market. That helped to prod a dip to USD/JPY, but that was a concentrated theme as price merely pushed down to the next spot of support at 146.65. Bulls crowded back in and by mid-day Friday price was already back at resistance of 147.68 and testing the high of the week.
Kanda’s comment wasn’t the only remark on the matter either as more indications showed later in the week but given price action it appears that the warnings haven’t been enough to scare bulls away from bidding the carry, which remains decisively tilted to the long side of USD/JPY.
The bigger question, however, given the timing of Kanda’s comment when resistance at 147.68 was already in-play, is whether the bank has a line in the sand and, if so, where that might be. This can lead to a bit of trepidation around resistance tests given that threat. This would also seem to be one of the more proactive scenarios for Yen bulls as there appears that there’s no signs of change on the horizon for Japanese monetary policy.
Unless, of course, the matter gets some assistance from the US side with softer data helping to bring on USD-weakness, similar to what showed in the pair in late-June. But that scenario appears to be on hold as US data has remained generally strong. Next week’s US CPI report on Wednesday will probably be a large push point for this theme, and then the Wednesday after brings the FOMC rate decision which will similarly have some pull on the matter.
In USD/JPY, there’s been strong support from bulls, most recently at the 146.65 level that I had talked about in the webinar, but also before that around the 145 level. For resistance at 147.68, a further breakout cannot be ruled out, of course, but that comes along with the question as to whether we’ll see a more-forceful attempt from Japanese policy makers to cool the matter.
USD/JPY Daily Price Chart
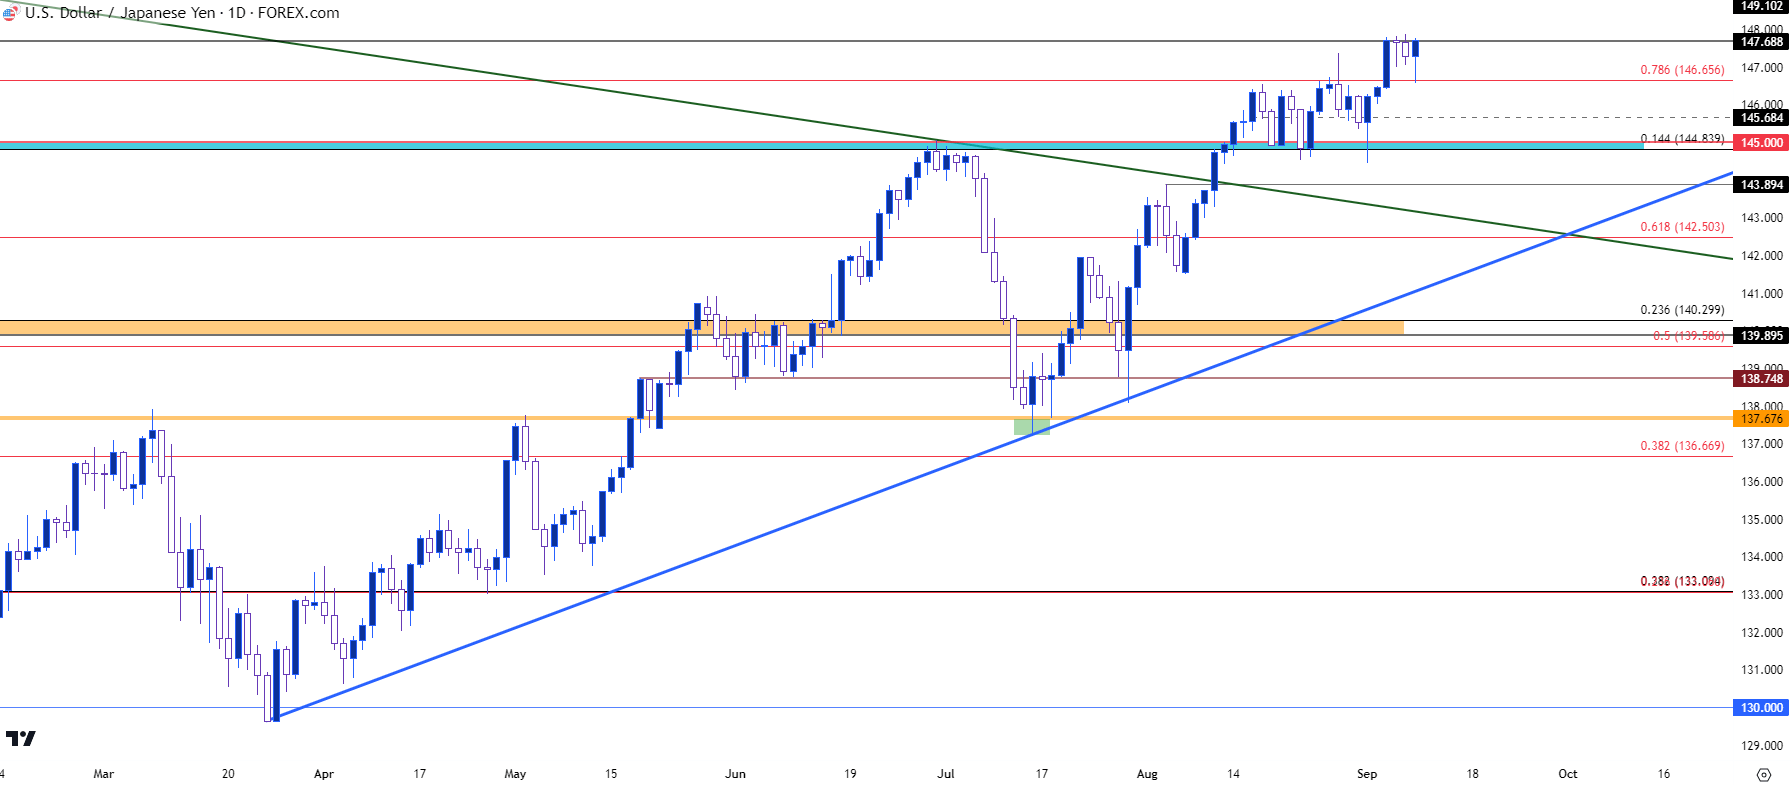
Chart prepared by James Stanley, USD/JPY on Tradingview
USD/JPY Longer-Term
Taking a step back helps to put this breakout into scope. But, perhaps more relevant is what it highlights above current price action, which was that vicious reversal in the pair last year when the Bank of Japan intervened to strengthen the Yen. This happened just above the 150 level but that now appears to be the line in the sand, so logically there could be some fear of re-tests over 150.
But on the way there, another resistance level exists at 149.10, so this may be a situation where bulls tiptoe above that resistance in a cautious manner until a lack of warning inspires a greater breakout. But there does appear to be a possible top-end to the move given the context of last year’s situation to go along with this recent warning. The high for 2022 was at 151.95, so anything above that could bring on worry of BoJ response.
USD/JPY Weekly Price Chart
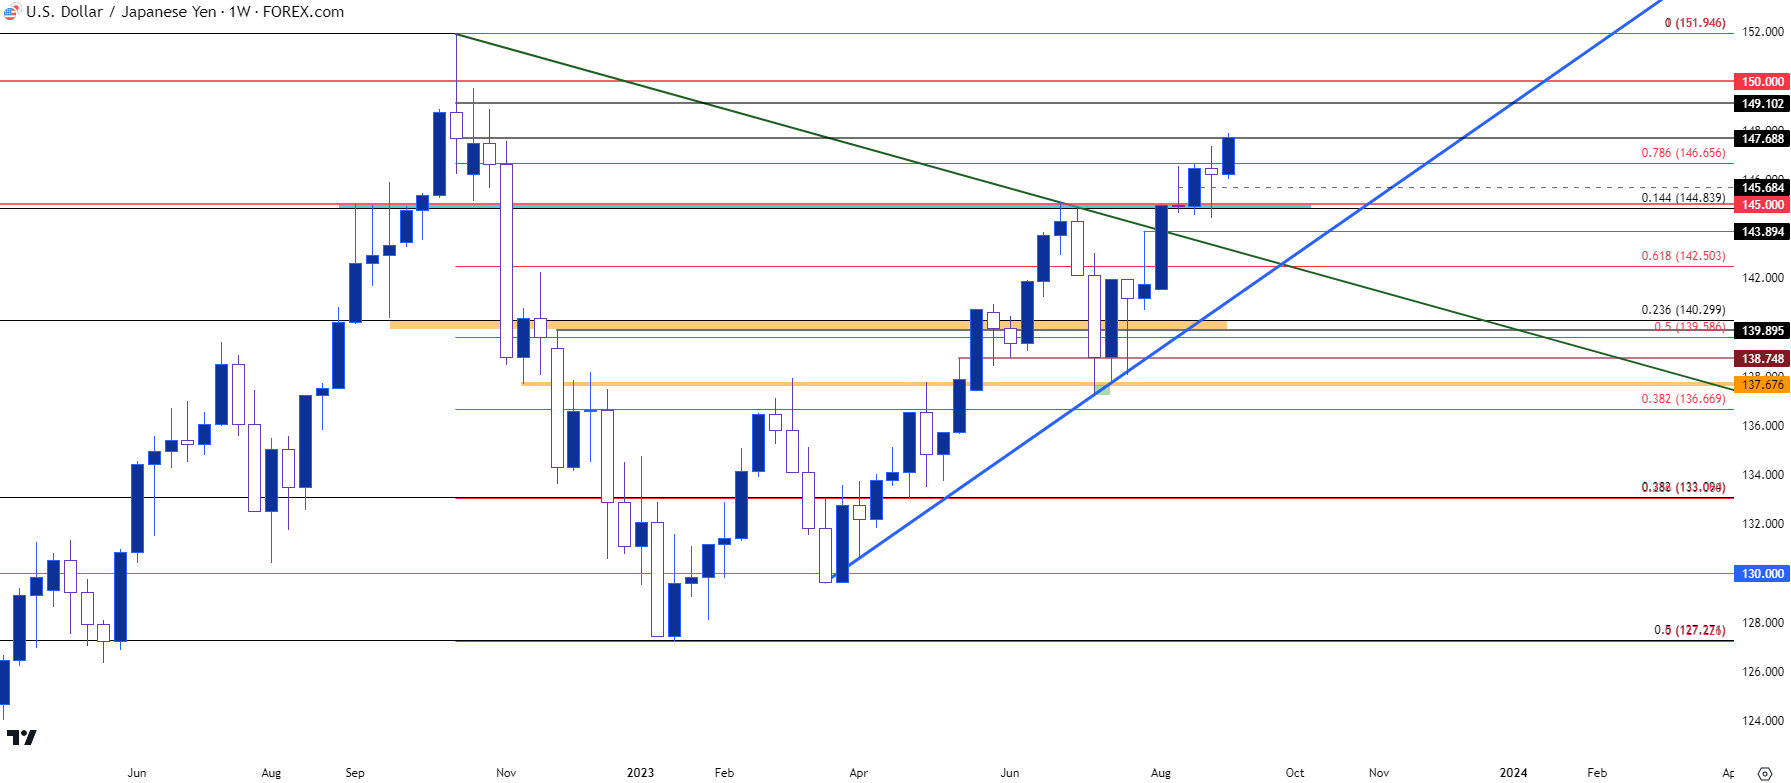
Chart prepared by James Stanley, USD/JPY on Tradingview
EUR/JPY
While the bullish breakout has continued to run in USD/JPY, the EUR/JPY pair has stalled over the past month and this week highlights an item of change.
While the past four weeks showed a resistance hold in the longer-term zone of 157.58-159.62, there was also a series of higher highs on those weekly candles. This kind of situation illustrates grinding price action with a somewhat bullish bias as each weekly candle ran up to a successive higher-high. But this weekly bar appears as though it will break that sequence. And this week’s low held right at last week’s low of 157.05. Collectively this starts to open the door to reversal potential, but that theme doesn’t appear ready yet, as we’ll dig deeper into that after the next chart.
EUR/JPY Daily Price Chart
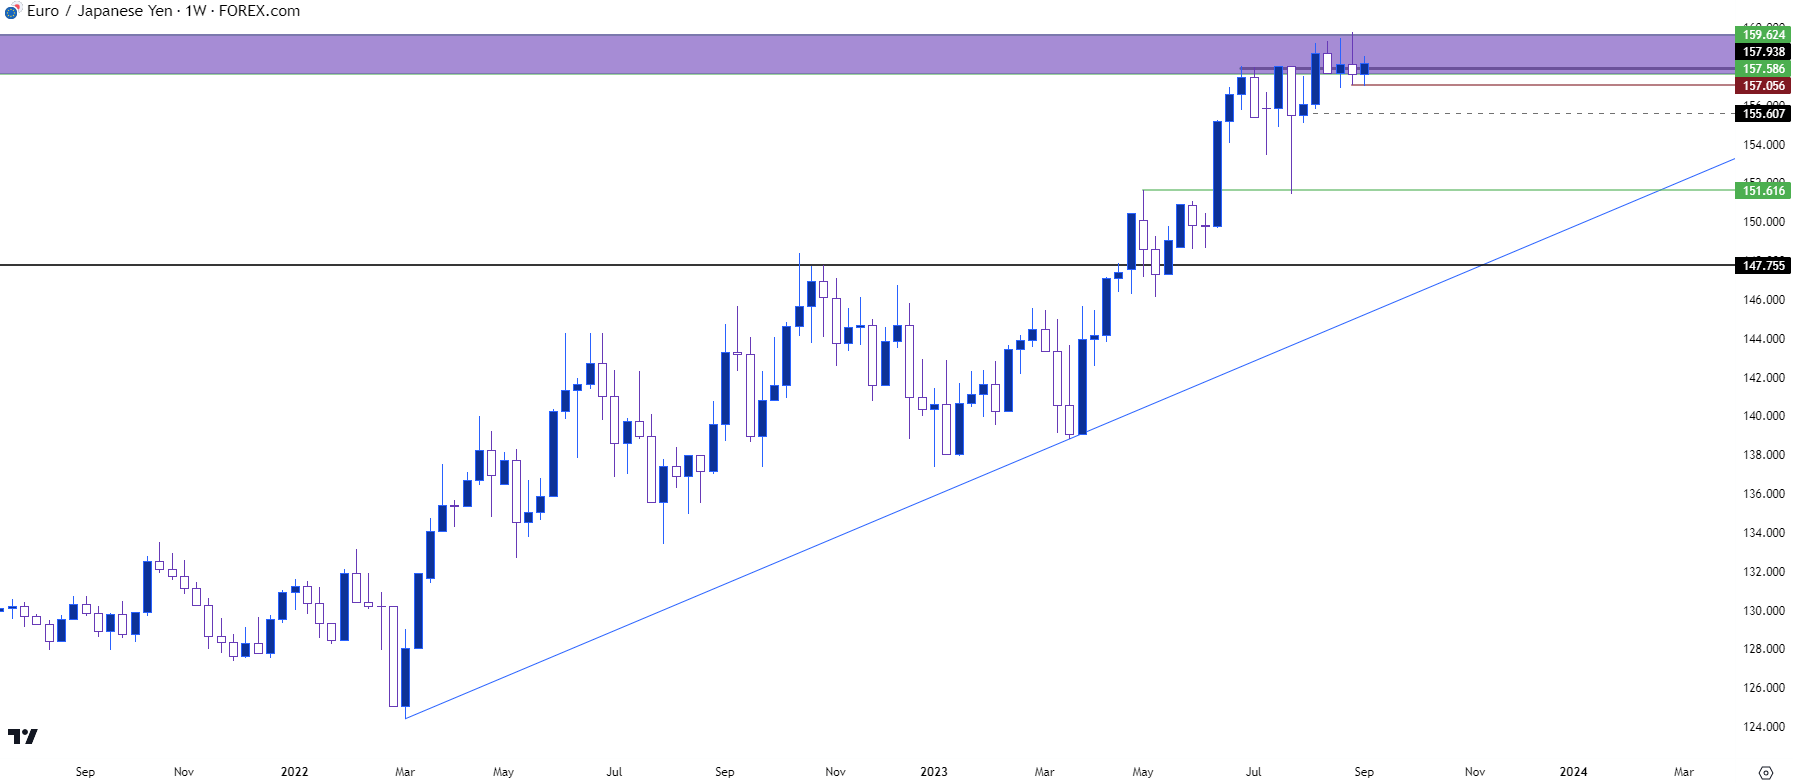
Chart prepared by James Stanley, EUR/JPY on Tradingview
Taking a step back to the monthly chart highlights what that wide zone from 157.58-159.62 is all about. This was a gap from back in 2008, just ahead of the Financial Collapse. And that gap has been filled, but when the breakout was running in the pair earlier this summer that was the zone that came back in to help stall the move and a month later, price is still struggling to break through.
As noted above, there has been a hold of support but this week’s lower-high begins to introduce questions for continuation scenarios.
Next week brings a European Central Bank rate decision and there’s an open question as to whether the ECB will hike again. This can open the door for capitulation scenarios, with bulls taking a quick push above resistance. And if that breakout then fails, this can start to open the door a bit more for reversal potential. Alternatively, if we do see bears make a push below 157.05, there will also be a lower-low to work with which could further substantiate reversal plays.
EUR/JPY Monthly Price Chart
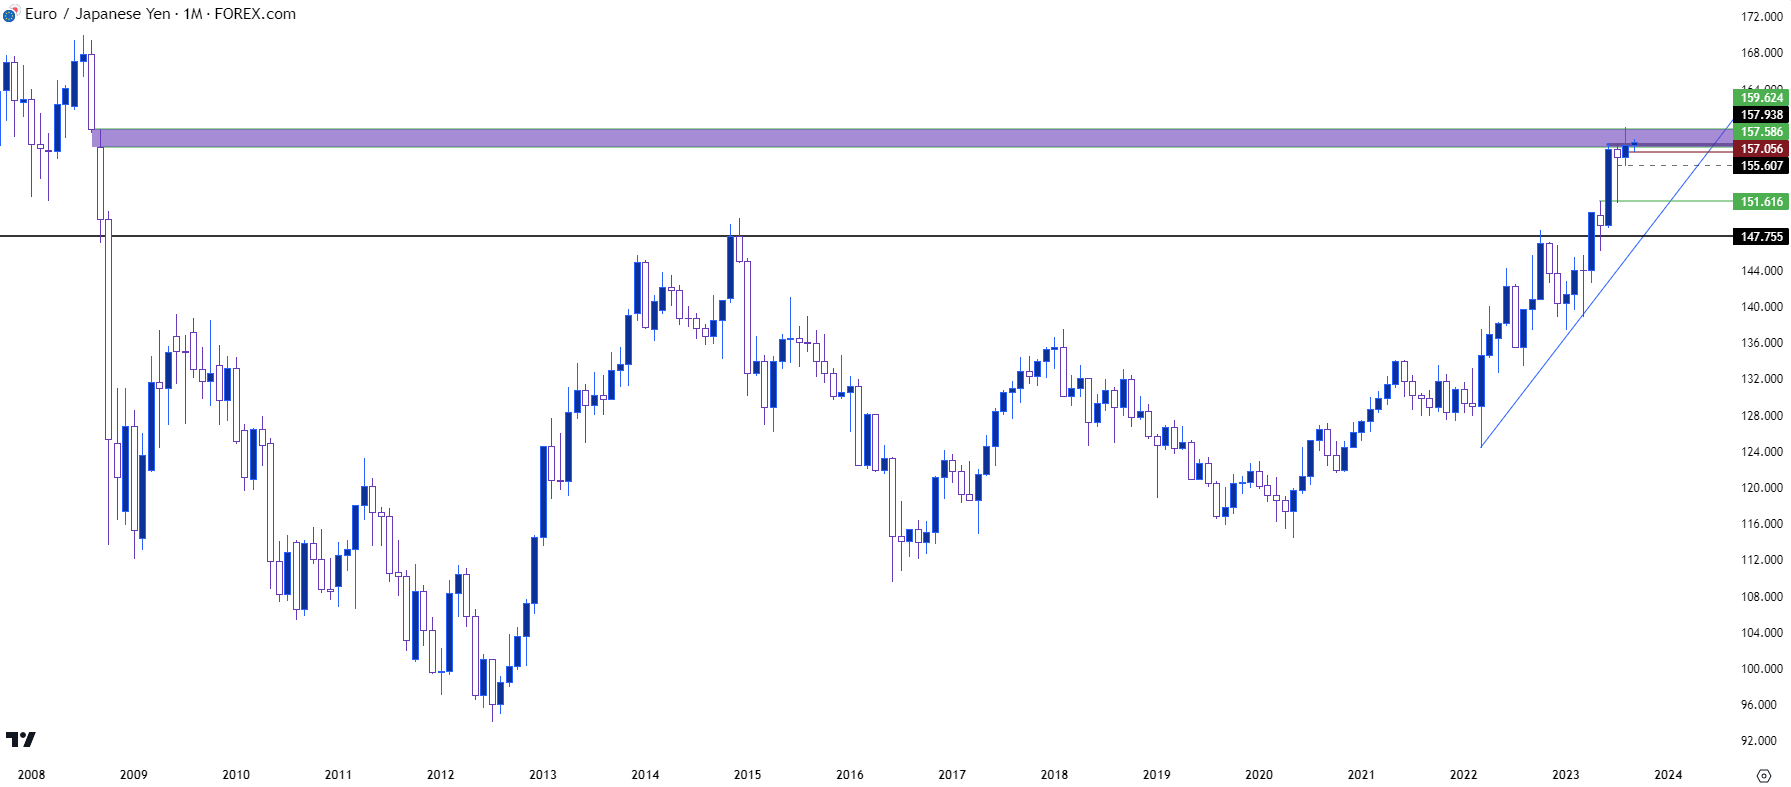 Chart prepared by James Stanley, EUR/JPY on Tradingview
GBP/JPY
In GBP/JPY, the pair has similarly shown stall on the weekly chart with some longer-term context coming into play. In this pair, it’s the Fibonacci level at 183.94, which still retains a tendency of support.
But that weekly bar is also showing its fourth consecutive week of indecision and reading between the lines this week would be the second consecutive lower high. That goes along with a lower low from this weekly bar which like the above in EUR/JPY, appears to illustrate reversal potential at some point down the road. It’s not quite there yet because support is still holding at 183.94 on a closed candle basis, which was resistance earlier in the summer.
GBP/JPY Weekly Price Chart
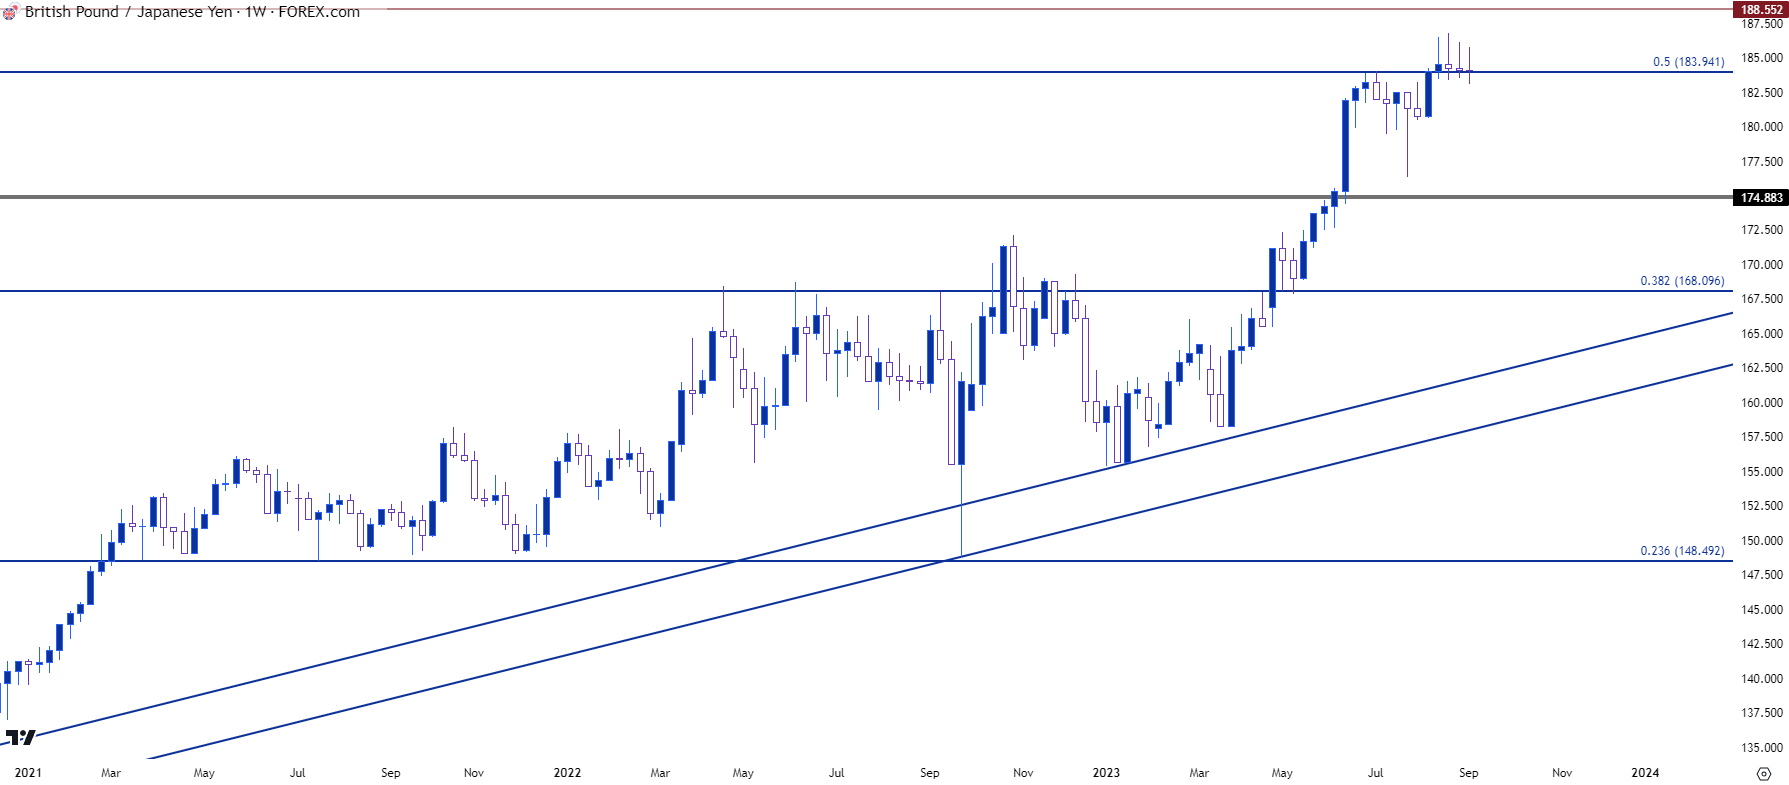 Chart prepared by James Stanley, GBP/JPY on Tradingview
GBP/JPY Longer-Term
Because we have that continued support at 183.94, we’d have to assume that bulls aren’t completely finished yet. And this would require entertaining a possible scenario of continuation.
On the fundamental side, the UK may have more to work with than Europe regarding bullish fundamental context as inflation remains well-elevated in both economies, but more so in the UK. So the BoE will likely need to keep addressing that issue while there seems to be greater expectation that Europe may be closer to turning the corner on inflation, if that hasn’t happened already after this week’s release of PPI showed at -7.6% YoY.
From the monthly chart of GBP/JPY there’s a big level sitting overhead at 188.55. This was a swing-low turned wing-high in 2015 ahead of a massive reversal in the pair. I expect that to retain some relevance if we do see a bullish continuation scenario develop, and that could be an area of resistance to investigate for swings, and perhaps even reversal scenarios under a similar scenario of capitulation as discussed on EUR/JPY.
The Ministry of Finance has already shown a willingness to burn capital finite capital reserves to keep speculators from crowding the short side of the Yen. And the weaker that the Yen gets, the more the potential for another warning or perhaps even an action rises. That 188.55 level in GBP/JPY could be a level that catches the attention from the BoJ, if it does come into play.
GBP/JPY Monthly Price Chart
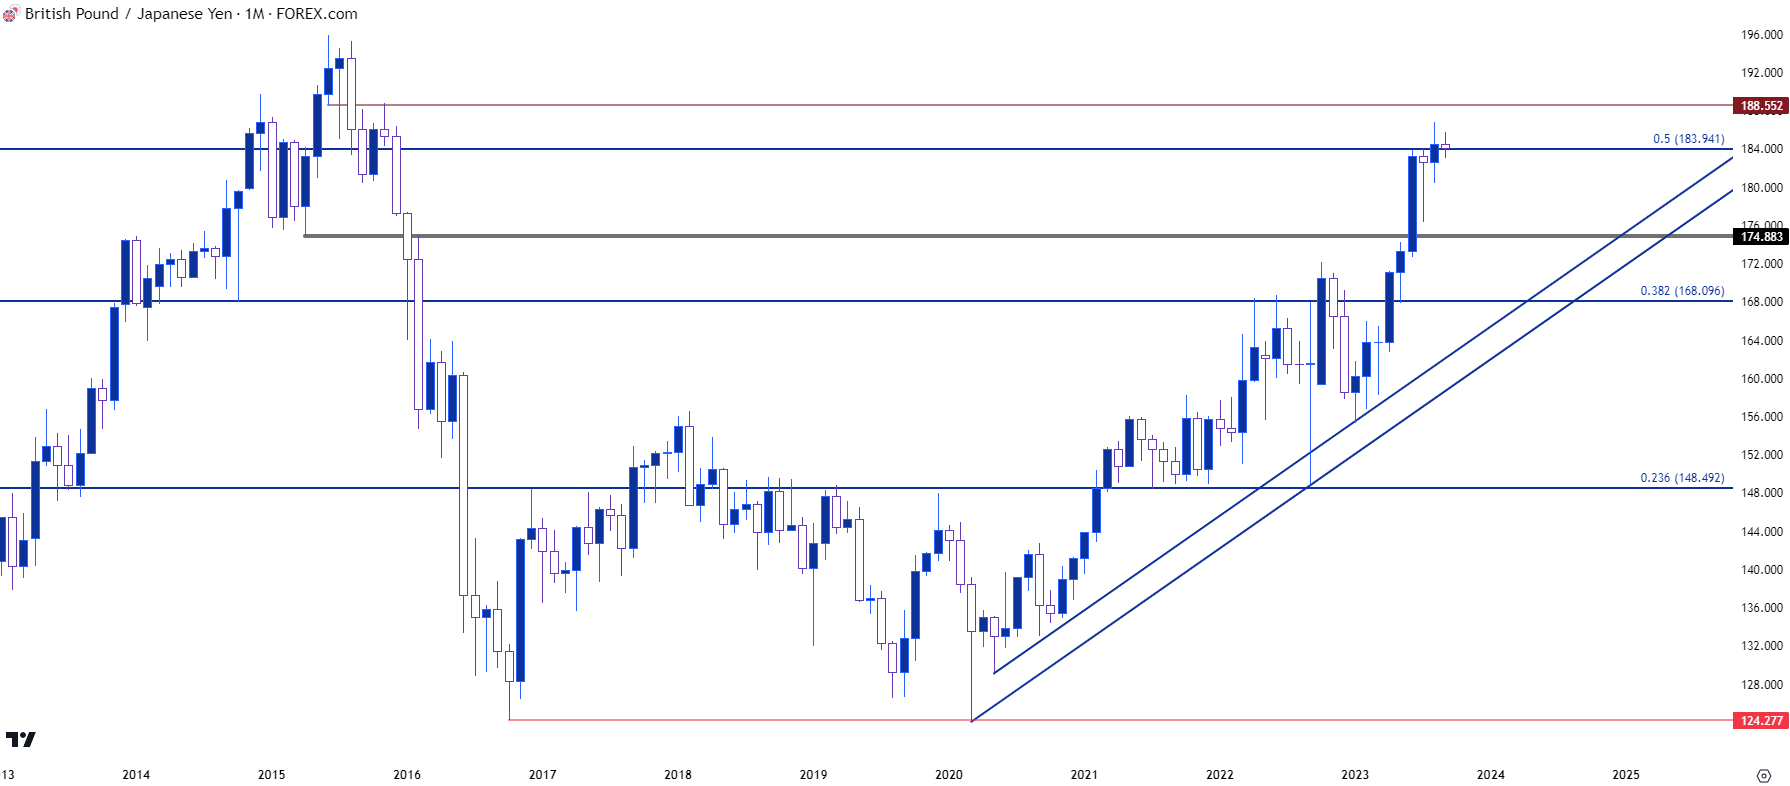 Chart prepared by James Stanley, GBP/JPY on Tradingview
--- written by James Stanley, Senior Strategist
Latest market news
Yesterday 01:32 PM
Yesterday 09:35 AM
Yesterday 07:23 AM
Yesterday 04:48 AM
Yesterday 12:17 AM
July 25, 2024 10:39 PM
Latest Trade Ideas articles

Yesterday 09:35 AM

Yesterday 12:17 AM

July 25, 2024 10:39 PM

July 25, 2024 05:30 PM