

We have all been watching USD/JPY continue to defy gravity and move closer to 150 – the infamous level which is which seemingly triggered Japan’s Ministry of Finance (MOF) instruct the Bank of Japan (BOJ) to intervene on 21 October 2022. It was a day which saw USD/JPY plunge nearly 4% from the day’s high to low before closing -1.6% lower. But perhaps more importantly, it marked the beginning of a -16.3% decline over the next 60 days.
The rate of comments form Japan’s officials are rising with USD/JPY
It's therefore no surprise that we’re all watching USD/JPY like hawks (for want of a better word) and keeping an ear out for comments from BOJ or MOF officials. And they are beginning to arrive. Earlier this week, currency diplomat Masato Kanda warned speculators that they will be watching currency markets “with a sense of urgency” and “won’t rule out any options for response to FX moves”. Other officials have also piled in, although we’re yet to see a material response from markets. But the key point here is that the rate of verbal comments from Japan’s officials are indeed rising along with USD/JPY, just as it did in the lead up to October’s lively high. It also makes USD/JPY susceptible to volatility, and we saw relatively high levels of it today just after Tokyo’s open.
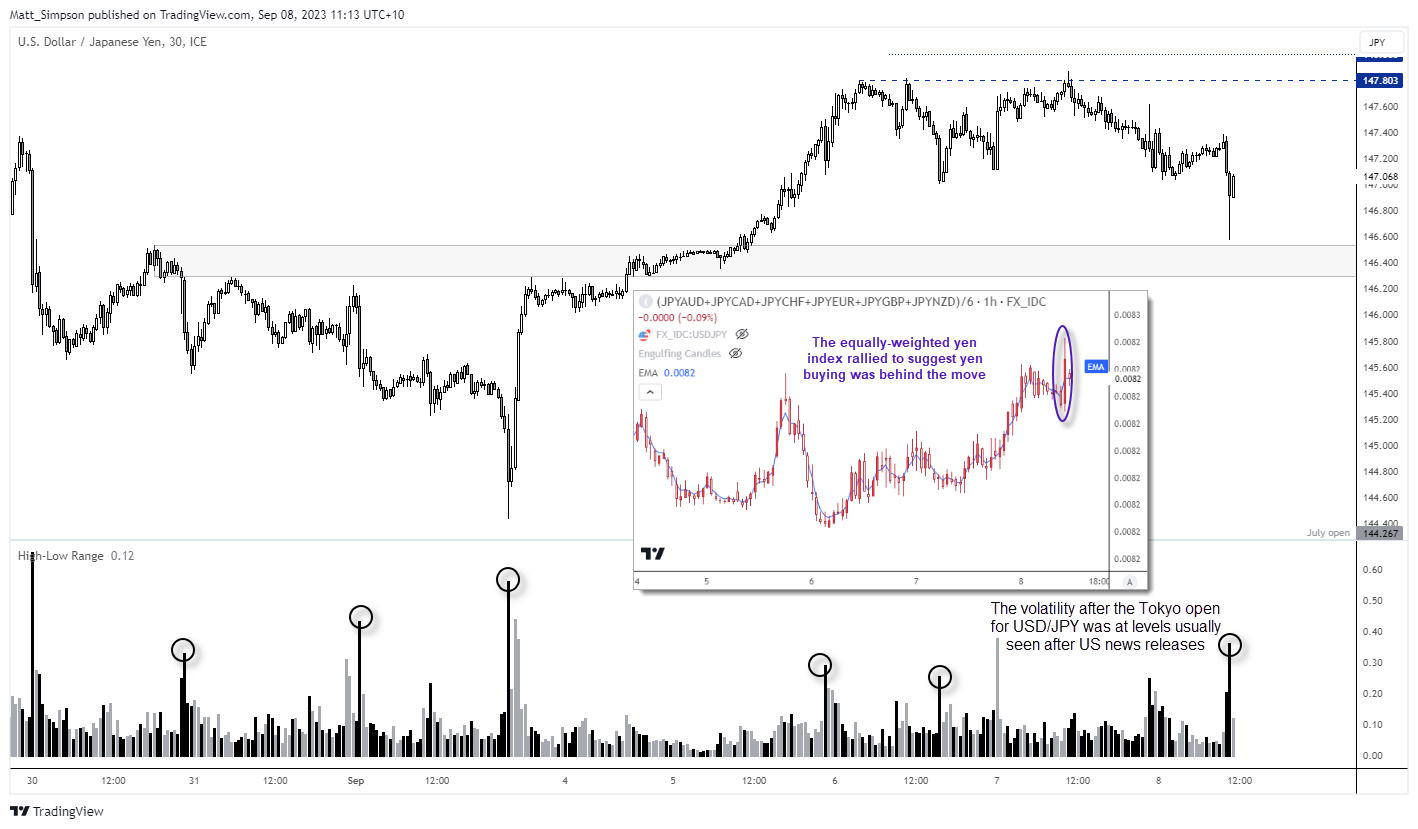
A lively start to the Asian session
USD/JPY has a lively start to the day after the Tokyo open, with the pair falling ~0.5% after the open. The pair was already softer following wages data and GDP data released ahead of the open, but we can see on the 30-minutute chart that volatility really ramped up on the hour as the cash market opened. In fact, the high-low range of the 30-minute candles rose to levels usually seen in the US session, not the Tokyo open. By my own calculations, the pip range is around twice the size of the 20-day ATR for that time of day.
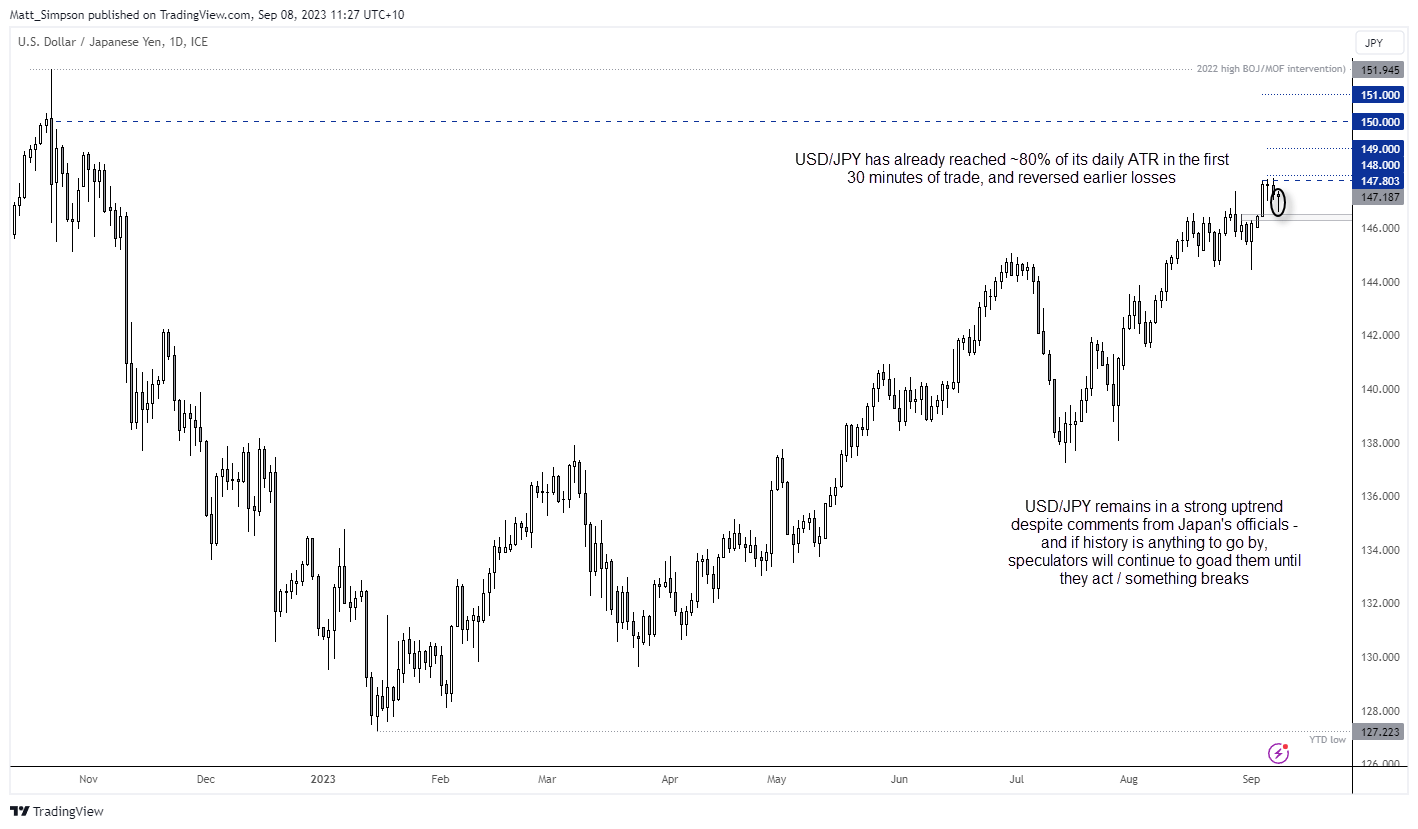
USD/JPY technical analysis (daily chart)
We can see on the daily chart that USD/JPY has already reversed its earlier losses, so if the day were to close around current levels it would leave a bullish hammer. The trend remains bullish despite early (and mostly ignored) verbal comments from Japan’s officials, and if the US dollar and yields continue to rise then it could just as easily take USD/JPY with it unless the MOF/BOJ pull the trigger.
At this stage, analysis of USD/JPY likely comes down to monitoring comments from officials, seeing how it reacts (if at all) and counting the handles it reaches. But if history is anything to go by, speculators might continue to bid USD/JPY up to levels until it irks the MOF/BOJ to act and shake them out of their positions.
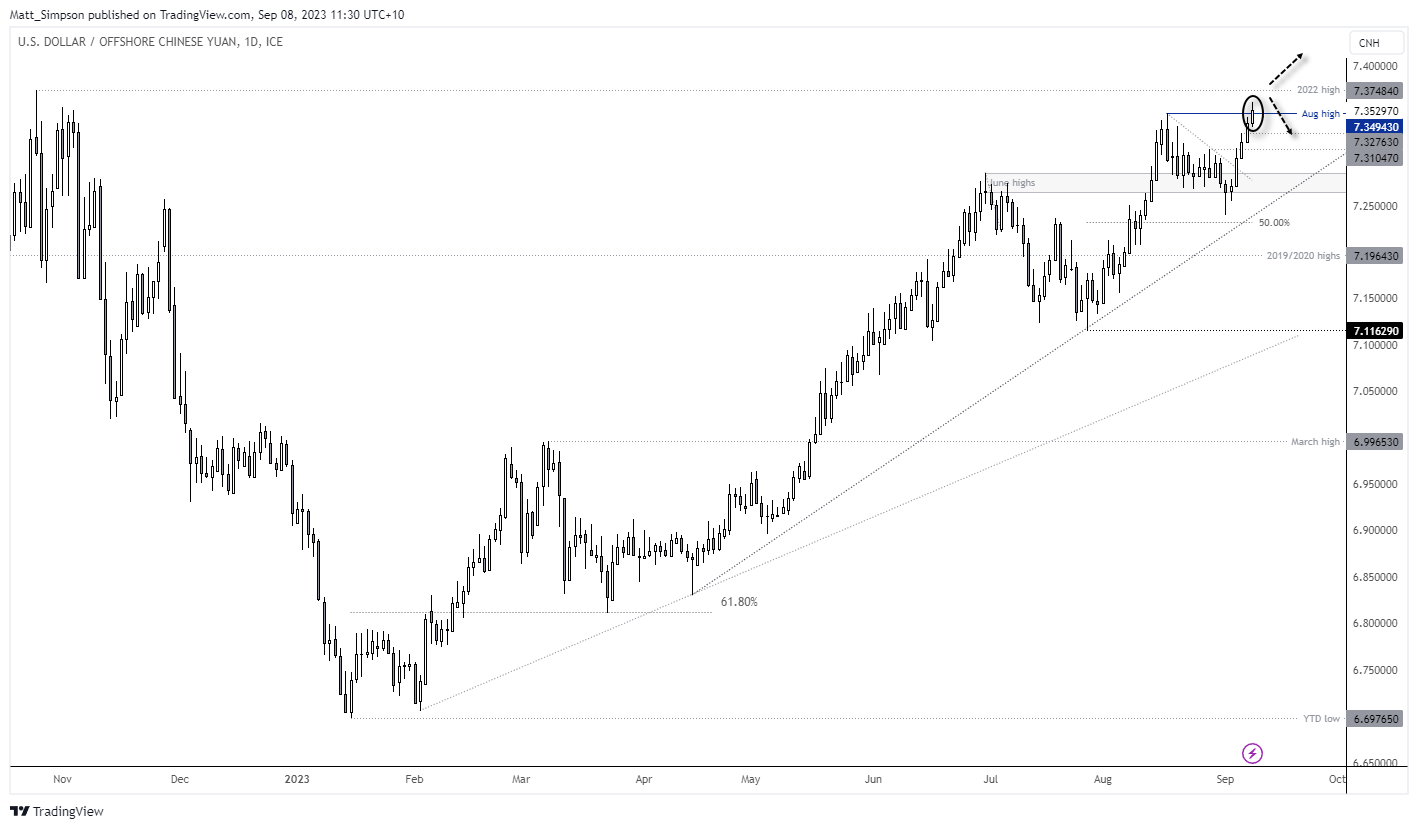
USD/CNH technical analysis (daily chart)
We have also seen USD/CNH break out to a 9-month high in line with its strong and established uptrend. Reaching just -0.19% from the 2022 high, it is debatable as to whether it has the strength to go ‘all the way’ and reach a multi-year high. And with reports earlier this week suggesting China’s state banks were actively selling USD/CNH, it may be worth monitoring prices to see if they can build a base above the August high – or switch to a bearish bias if it breaks lower and deems to be a fakeout.
-- Written by Matt Simpson
Follow Matt on Twitter @cLeverEdge
How to trade with City Index
You can trade with City Index by following these four easy steps:
-
Open an account, or log in if you’re already a customer
• Open an account in the UK
• Open an account in Australia
• Open an account in Singapore
- Search for the market you want to trade in our award-winning platform
- Choose your position and size, and your stop and limit levels
- Place the trade
Latest market news
Yesterday 01:32 PM
Yesterday 09:35 AM
Yesterday 07:23 AM
Yesterday 04:48 AM
Yesterday 12:17 AM
July 25, 2024 10:39 PM
Latest Trade Ideas articles

Yesterday 09:35 AM

Yesterday 12:17 AM

July 25, 2024 10:39 PM

July 25, 2024 05:30 PM