November 16, 2022 4:56 PM

US Retail Sales for October came in stronger than expected at +1.3% MoM vs and expectation of +1% MoM and a previous reading of 0% MoM. This was the strongest reading since February. In addition, Retail Sales-Ex Autos rose to 1.3% MoM vs an estimate of +0.4% MoM and a September reading of only +0.1% MoM. This indicates that sales were strong not only in autos, but in other parts of the economy as well. Yesterday, Walmart crushed sales earnings expectations for Q3 noting that inventory levels have been reduced and that the company only has $1 billion in unwanted inventory as it expects to see sales rise into the shopping season. However, Target reported almost the complete opposite of Walmart, as it dramatically missed EPS expectations for Q3. The company reported EPS of $1.54 vs a consensus of $2.19! Target’s CEO said that “in the latter weeks of the quarter, sales and profit trends softened meaningfully, with guests shopping behavior increasingly impacted by inflation, rising interest rates, and economic uncertainty.” In addition, Target cut its Q4 forecasts heading into the holiday season. Given the strong retail sales numbers from October, one may conclude that Target’s problems have to do with its inventory management, rather than the overall strength of underlying consumer spending.
Target’s stock price has fallen dramatically from its all-time high of 268.98 on November 15th, 2021. The stock dropped lower after its Q1 earnings were announced on May 17th, from 215.28 to 163.07. The stock price made a Year-to-Date low on June 30th at 137.26 and retraced to the 38.2% Fibonacci retracement level from the highs of April 21st to the lows of June 30th, near 182.13. However, after today’s poor earnings, the stock dropped from yesterday’s close of 178.98 down to 149.85! Support is at the June 30th lows of 137.16, while resistance isn’t until the gap fill at 176.90.
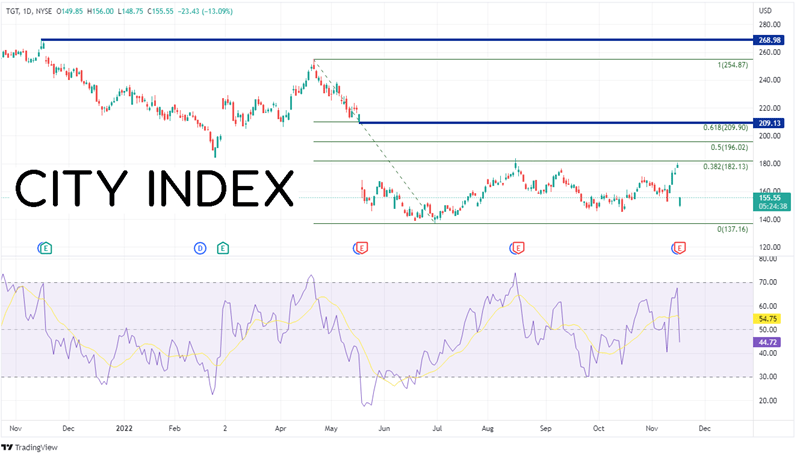
Source: Tradingview, Stone X
Trade TGT now: Login or Open a new account!
• Open an account in the UK
• Open an account in Australia
• Open an account in Singapore
In general, the US Dollar was not particularly phased by the better-than-expected Retail Sales data. The US Dollar Index is down slightly on the day as the DXY continues its recent sell-off to the 50% retracement from the lows of March 31st to the highs of September 28th near 106.23. If price continues to move lower, support is at the upward sloping trendline dating to May of 2021 (green) near 105.00, then horizontal support at the lows from August 11th near 104.65. Below there, price can fall to the 61.8% Fibonacci retracement level from the previously mentioned timeframe at 104.22. However, if the DXY bounces, resistance sits above at previous lows near 107.59. Above there, price can stop at the bottom trendline of the recent short-term channel near 109.02 and then horizontal resistance at 109.27.
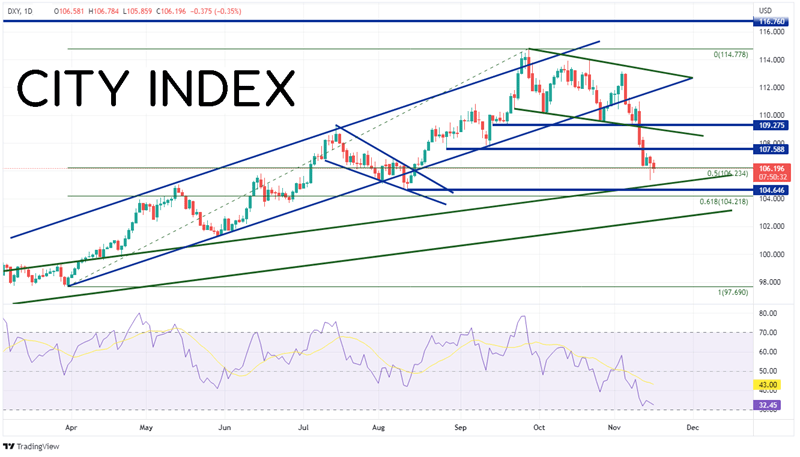
Source: Tradingview, Stone X
Trade the DXY now: Login or Open a new account!
• Open an account in the UK
• Open an account in Australia
• Open an account in Singapore
US Retail Sales for October were much better than expected and Walmart suggests in its guidance that strong data could continue through the holiday season. However, Target missed on earnings and downgraded its forecasts into Q4. Who will be right? “Never underestimate the American consumer” is a phrase often tossed around. If the saying is correct, we could see a good holiday season!
Learn more about forex trading opportunities.
Latest market news
Yesterday 01:32 PM
Yesterday 09:35 AM
Yesterday 07:23 AM
Yesterday 04:48 AM
Yesterday 12:17 AM
July 25, 2024 10:39 PM
Latest Trade Ideas articles

Yesterday 09:35 AM

Yesterday 12:17 AM

July 25, 2024 10:39 PM

July 25, 2024 05:30 PM