

GBP/USD falls as stagflation fears rise
GBP/USD is falling, extending losses from the previous week.
Data showed that the UK economic growth slowed to almost a standstill in February, even before the fallout from the Ukraine war had really been felt or reflected in the UK economy. UK GDP rose just 0.1% MoM in February, down from 0.8%^ in January.
The data underscores the challenges faced by BoE policymakers, who are stuck between a rock and a hard place right now. The central bank must decide whether to tame 30-year high inflation, which is expected to keep rising as energy prices surge or whether to stop in its tracks with rate hikes to maintain growth supported while allowing inflation to run wild. However, high inflation and stalling growth bring stagflation fears front and center, hitting demand for the pound.
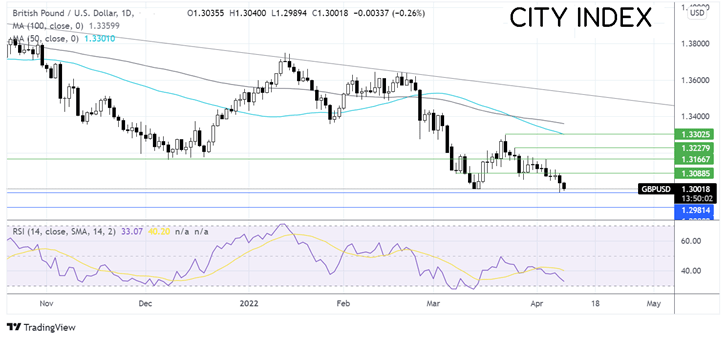
GDP/USD has fallen below the critical psychological level of 1.30, bringing last week’s 2022 low of 1.2980 into focus.
Central bank divergence is a big theme, here as the Fed is looking to act more aggressively to tighten monetary policy over the coming months, with a potential 50 basis point hike in May.
Learn more about trading GBPUSDWhere next for GBP/USD?
GBP/USD has been trending lower since March 23, forming a series of lower lows and lower highs; the pair is testing support at 1.30, the key psychological level. The RSI suggests that there is more downside to come.
Should sellers meaningfully break below 1.30, this opens the door to last week’s low of 1.2980, bringing the October 2020 low of 1.29 into target.
However, should the support at 1.30 hold, this could form a double bottom reversal sending the price higher towards support at 1.3085 the March 8 low, and then 1.3175, the December low.
CAC rallies after the first round of the French elections
The French CAC is outperforming its European peers after the first round of the French presidential elections on Sunday.
Macron and far-right nationalist Marine Le Pen qualified for the second and final round on Sunday 24th. While the race is tight, Macron is still holding the lead, which has brought a sense of relief to the markets.
The CAC is rising firmly high, outperforming peers such as the DAX or the FTSE after underperforming last week.
Broadly speaking, investors are cautious ahead of a busy week for central bank interest rate decisions. The ECB will give its rate decision on Thursday.
Learn more about trading the CACWhere next for the CAC?
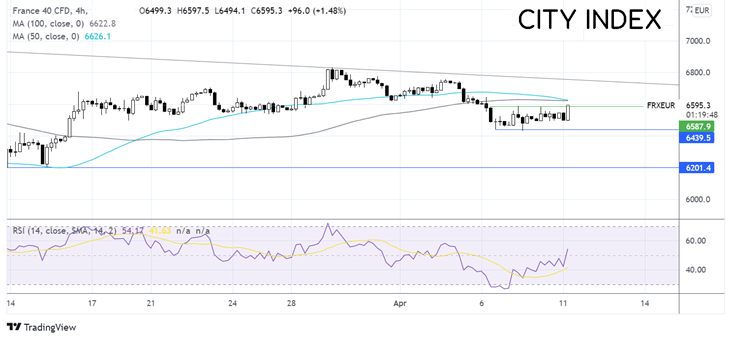
The CAC has been trending lower since late March before hitting a low of 6430 last week, which pushed the RSI into oversold territory and now acts as the near-term support.
Since then, the price has been grinding higher, with 6600 acting as a barrier across the last week. Buyers will want to see a move over 6600 resistance and the 50 & 100 sma at 6630 in order to bring 6750, the falling trendline resistance, into play.
On the downside, a break below 6430 could open the door to 6200, the 15 March low.
How to trade with City Index
Follow these easy steps to start trading with City Index today:
- Open a City Index account, or log-in if you’re already a customer.
- Search for the market you want to trade in our award-winning platform.
- Choose your position and size, and your stop and limit levels
- Place the trade.
Latest market news
Yesterday 01:32 PM
Yesterday 09:35 AM
Yesterday 07:23 AM
Yesterday 04:48 AM
Yesterday 12:17 AM
July 25, 2024 10:39 PM
Latest Trade Ideas articles

Yesterday 09:35 AM

Yesterday 12:17 AM

July 25, 2024 10:39 PM

July 25, 2024 05:30 PM