

Nvidia's share price surged up to 10% after Wednesday’s close, thanks to yet another blowout earnings report. Revenue rose an impressive 88% to $13.5 billion versus $11 expected, EPS reached a record $2.70 and Q3 revenue guidance upped to $16 billion versus $12.5 billion expected.
In addition to the strong earnings report, Nvidia also announced a number of new products and partnerships during the earnings call. These included the launch of its new Grace CPU and Hopper GPU, as well as a partnership with Microsoft to bring AI to the cloud. This was all well received by investors who expect that Nvidia will continue to benefit from the growing demand for artificial intelligence (AI) and gaming chips
Key takeaways from Nvidia’s Q2 earnings report
- Strong earnings report that beat analyst expectations
- Forecasted third-quarter revenue above analysts' expectations
- Growing demand for AI and gaming chips
- Launch of new products and partnerships
- Positive sentiment towards the technology sector
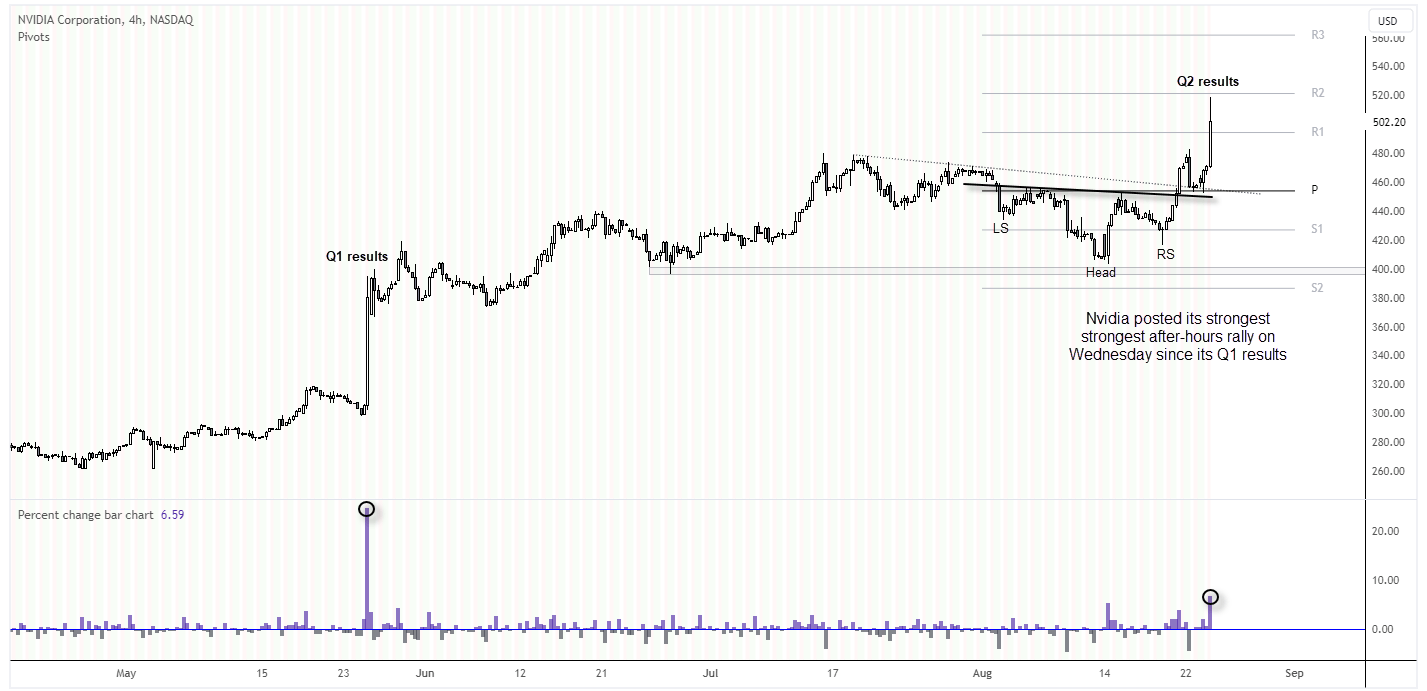
Nvidia (NVDA) technical analysis – 4-hour chart:
Nvidia remains the strongest performer on the Nasdaq by a long shot, having risen 222.4% YTD by Wednesday’s close, compared with Meta’s 114.5% in second place. I’ll admit to wondering whether earnings may disappoint (given the headlines of users of chat GDP losing pace), but it can also serve as a reminder not to bet against a trend without complete conviction.
The four-hour chart shows that support was found just above $400, and an inverted head and shoulders pattern formed beneath a retracement line. The initial breakout on Monday saw prices retrace towards the H&S neckline and retracement line before forming a swing low. The after-hour rally was its most bullish since Q1 earnings were released in May, and prices rose promptly towards the monthly R2 pivot point, near the H&S target to reach a record high.
- Given prices are already considering a move back below $500, traders may seek to buy dips above or around $460 with an open upside target, in hope of riding this monstrously bullish trend.
- A break below $400 assumes a higher timeframe correction is underway.
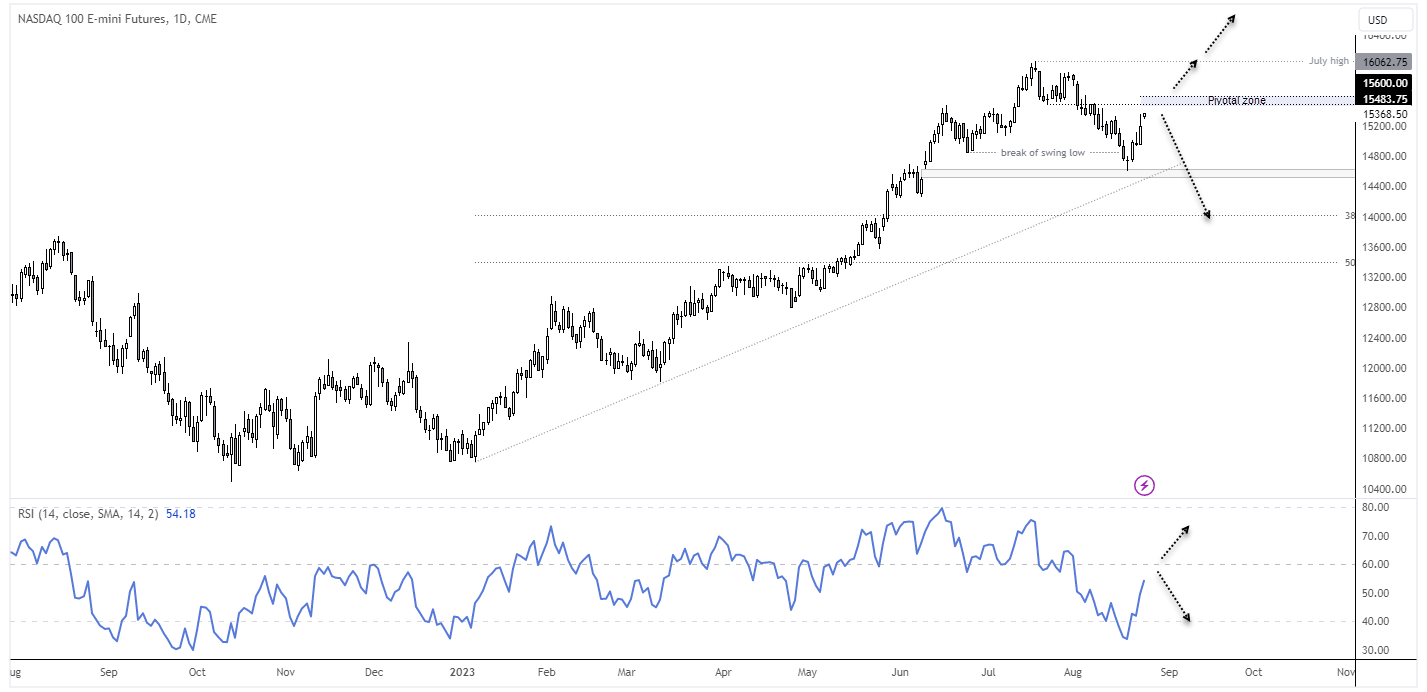
Nasdaq 100 technical analysis (E-mini futures, daily chart):
In Monday’s weekly COT report, I flagged that asset managers had little to no appetite being short Nasdaq 100 futures. Sure, they remain net long by a large amount, but we’d need to see a combination of falling gross longs and rising gross shorts to be more confident that positioning was providing a reversal signal. And until that occurs, the basic assumption is that the 3-week decline from the July high is part of a healthy retracement as oppose to a larger, bearish reversal.
But with the Jackson Hole meeting and a key speech form Jerome Powell looming, we could be headed for a binary outcome for global markets which either supports a more hawkish Fed (higher USD, lower stocks) or less-hawkish-than-expected Fed (higher stocks, lower USD).
The Nasdaq 100 E-mini futures chart shows that a strong bullish trend structure overall, and prices now sit at a 6-day high. Strong Nvidia earnings have seen the market gap up over 1% since Wednesday’s close.
RSI (14) reached oversold (below 40 in an uptrend) yet remains beneath 60 (neutral in an uptrend). It therefore remains unclear whether the lows above 14,400 is ‘the’ corrective low, or simply the first wave lower.
I suspect the 15,600 zone may prove pivotal over the near-term, and momentum may wane if prices approach it. Therefore, traders may want to remain nimble, or wait for the conclusion of Powell’s speech to see which way he guides markets.
-- Written by Matt Simpson
Follow Matt on Twitter @cLeverEdge
How to trade with City Index
You can trade with City Index by following these four easy steps:
-
Open an account, or log in if you’re already a customer
• Open an account in the UK
• Open an account in Australia
• Open an account in Singapore
- Search for the market you want to trade in our award-winning platform
- Choose your position and size, and your stop and limit levels
- Place the trade
Latest market news
Yesterday 06:37 AM
April 26, 2024 01:25 PM
April 26, 2024 11:40 AM
April 25, 2024 03:09 PM
Latest Trade Ideas articles

April 26, 2024 11:40 AM

April 25, 2024 03:00 PM

April 25, 2024 11:14 AM
April 24, 2024 11:00 AM