

We can see on the weekly chart that the STI is within a 5-wave impulsive move which began at the March 2020 low. Wave 3 stalled at a 127.2% Fibonacci ratio and Feb 2020 high, and may have since completed a 3-wave correction. We suspect the correction is complete as it held above 3,000 (significant round number), the May low and 200/50 week eMA’s.
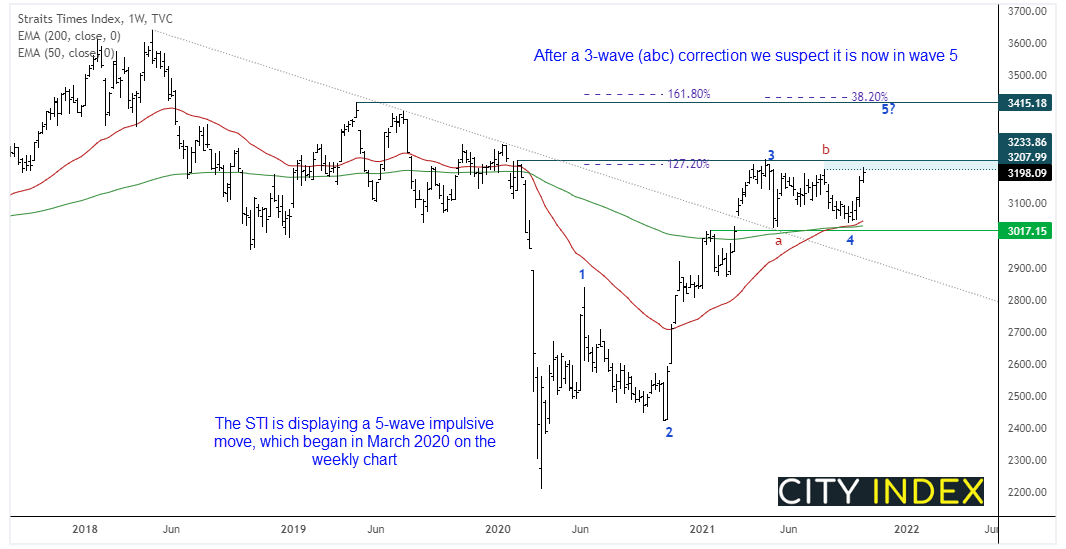
Furthermore, as bullish momentum has now realigned with wave-3, we’re now anticipating an eventual break above 3224 on its way to our wave-5 target around 3400. The target coincides with the April 2019 high and 38.2% expansion. However, there may be reason to suspect it may not break higher immediately and instead pull back from current levels beforehand.
Correlations matter
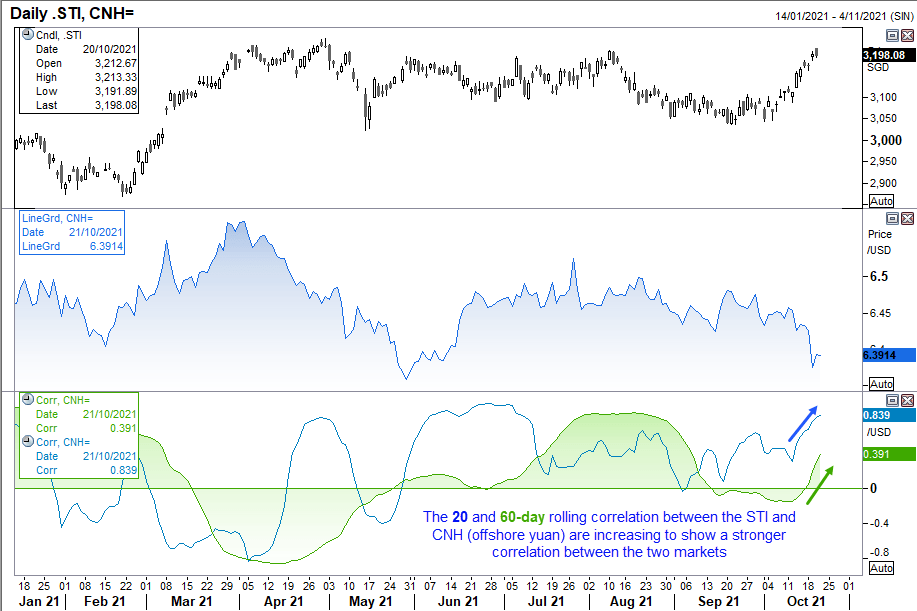
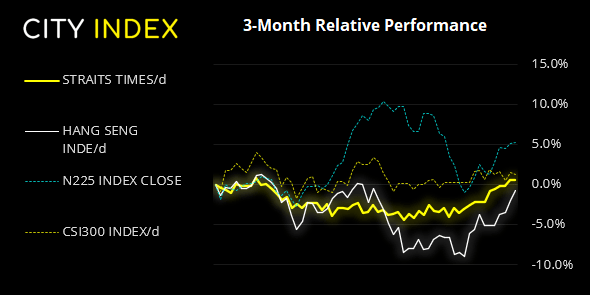
If we look at the relationship between the STI and USD/CNH, they share an inverted correlation. It is not perfect, but good enough to see a relationship exists over the longer-term. CNH is offshore Yuan, and if it increases in strength (USD/CNH moves lower) then it can be supportive of Asian markets such as the STI as CNH flows into them. However, by using a correlation indicator of the two markets we also note that the rolling 1-month (20 day) and 3-month (60-day) correlations are increasing which show the relationship has become increasingly stronger over recent weeks.
It is therefore worth noting that CNH is approaching a key level of support at 6.35 and, if it holds (at least initially), it suggests that STI may stall or retrace from the nearby resistance zone.
If USD/CNH bounces, STI could retrace
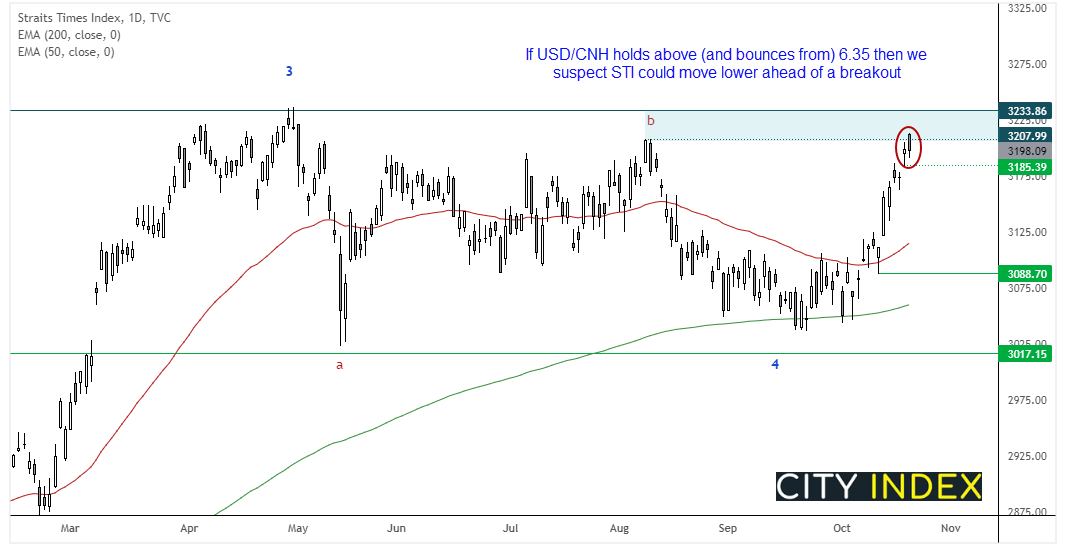
The daily chart shows its rally has stalled at the lower bound of a resistance zone. A spinning top Doji and 2-bar reversal (Dark Cloud cover) suggest near-term exhaustion on the daily chart, and a move lower could be a higher probability event should USD/CNH bounce from support.
- A break below 3185 confirms a minor correction is underway against the daily trend.
- However, as the daily trend remains bullish above 3088 it leaves quite a bit of wriggle room for a retracement, should USD/CNH bounce considerably from current levels.
- Overall, we anticipate STI to eventually break above 3244 as part of its wave-5 move.
How to trade with City Index
You can trade easily trade with City Index by using these four easy steps:
-
Open an account, or log in if you’re already a customer
• Open an account in the UK
• Open an account in Australia
• Open an account in Singapore
- Search for the company you want to trade in our award-winning platform
- Choose your position and size, and your stop and limit levels
- Place the trade
Latest market news
Yesterday 01:32 PM
Yesterday 09:35 AM
Yesterday 07:23 AM
Yesterday 04:48 AM
Yesterday 12:17 AM
July 25, 2024 10:39 PM
Latest Trade Ideas articles

Yesterday 09:35 AM

Yesterday 12:17 AM

July 25, 2024 10:39 PM

July 25, 2024 05:30 PM