
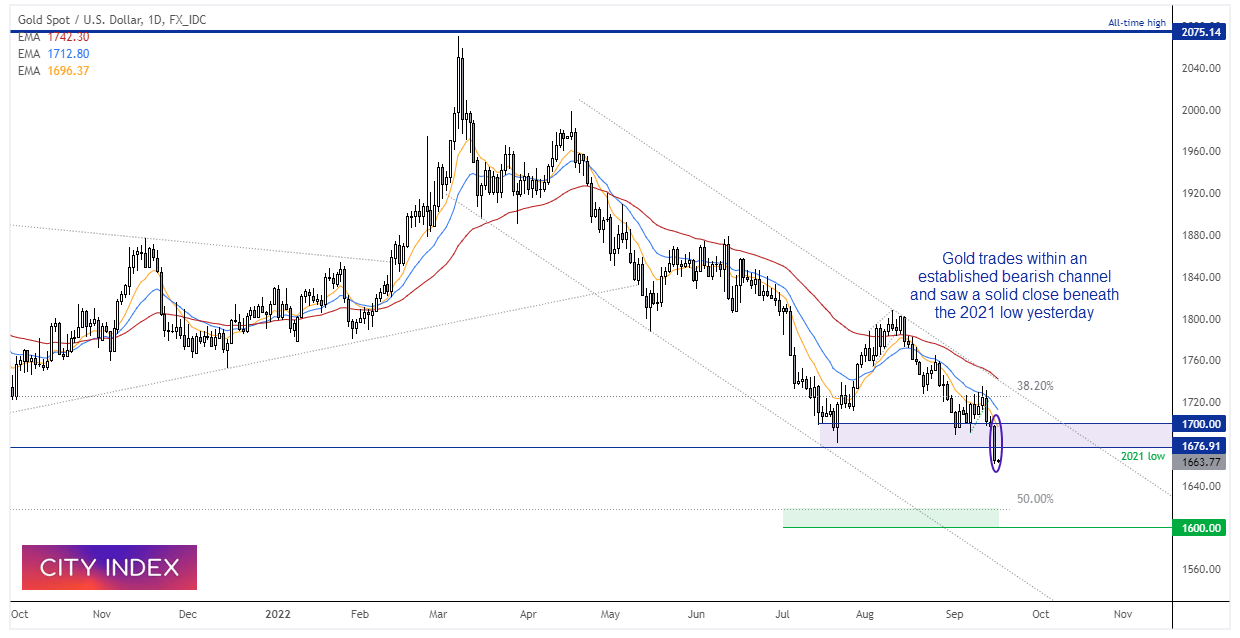


Many traders across Asia will be looking at their spot gold charts today after its solid close beneath the 2021 low. Such moves can spark another round of selling as investors flea for the exit. And who could blame them, if we take a step back to admire the bigger picture view of gold?
The daily chart is within an established downtrend and remains within a bearish channel. Prices remains below all major moving averages which are now fanning out as momentum accelerates lower. And this week has seen prices accelerate out of a bearish continuation pattern.
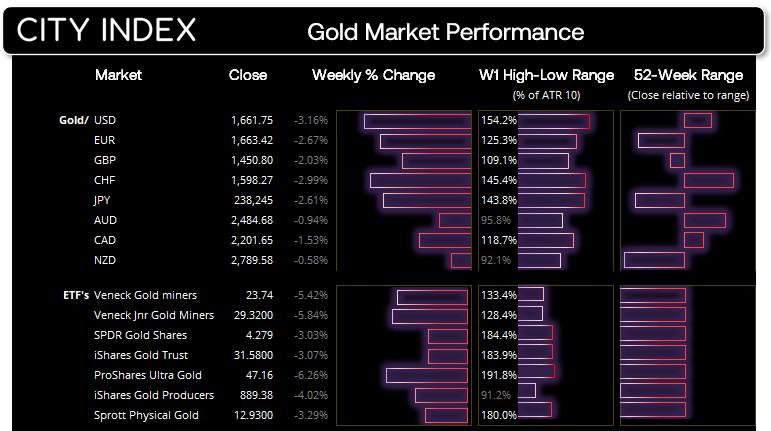
Furthermore, gold ETF physical holdings have been trending lower since the April high, net-long exposure to gold futures is near levels not seen since early 2019 among large speculators. And managed funds are actually net-short gold futures. The US dollar is on an epic rally some banks calling for Fed funds to raise to 5%. This is the perfect storm for lower gold prices over the longer-term.
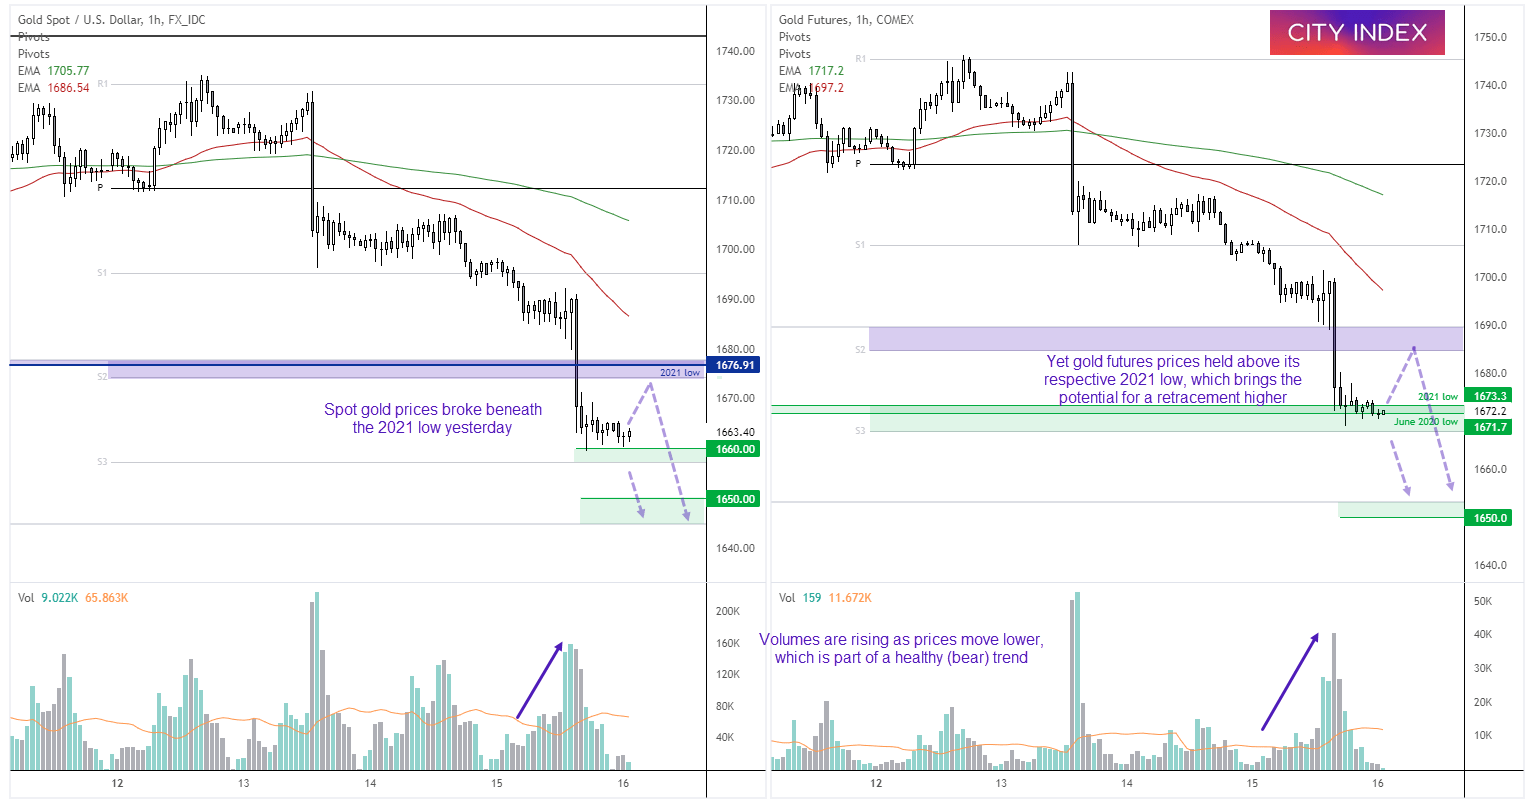
Spot gold vs gold futures 1-hour chart:
But before gold speculators decide to go 'all in' at these lows on spot gold prices, it may be beneficial to also look at gold futures prices in tandem – particularly those trading shorter timeframes such as intraday charts to a few days.
Whilst spot gold (left chart) closed to its lowest level since April 2020, the futures chart has managed to hold above its respective 2021 low its June 2020 low. Prices are coiling within a small pennant, so perhaps we'll see it break lower in due course, in which case spot gold prices may continue lower. But also note that both markets are holding above their weekly S3 pivots.
Therefore, given the significance of these levels I am leaning towards a retracement higher for futures and spot gold prices before its bearish trend resumes.
- Countertrend trends could seek bullish setups if momentum turns higher (seek a series of bullish hammers, bullish engulfing candle etc) and aim for the spot 2021 low.
- Or bears could seek evidence of a swing high below the 2021 lows, with the aim to re-join the bearish trend at higher prices.
- But if futures and spot move lower, bears clearly have the upper hand and the trend is assumes to have resumed.
How to trade with City Index
You can easily trade with City Index by using these four easy steps:
-
Open an account, or log in if you’re already a customer
• Open an account in the UK
• Open an account in Australia
• Open an account in Singapore
- Search for the company you want to trade in our award-winning platform
- Choose your position and size, and your stop and limit levels
- Place the trade
Latest market news
Yesterday 03:00 PM
Yesterday 01:12 PM
Yesterday 11:14 AM
Latest Technical Analysis articles
April 24, 2024 02:03 AM
April 22, 2024 04:33 PM
April 21, 2024 11:20 PM
April 15, 2024 07:13 PM