

Fitch Ratings downgraded the United States' long-term credit rating to AA+ on Tuesday night, removing the country from its coveted triple-A status. The downgrade comes after months of political brinkmanship in Washington, D.C., that led to a last-minute deal to raise the debt ceiling.
The downgrade does not mean that the US is about to default on its debt. However, it does make it more expensive for the government to borrow money, which could have a negative impact on the economy.
Fitch has placed the US rating on a "stable" outlook, which means that it does not expect any further downgrades in the near future. However, the agency warned that the rating could be downgraded if the US government's fiscal situation does not improve.
Fitch outlined the following reasons for the downgrade:
- A steady deterioration in standards of governance over the last 20 years
- Rising general government deficits due to cyclically weaker federal revenues
- The debt-to-GDP ratio remains “well above the pre-pandemic 2019 level” at 112.9% and expected to rise to 118.4% by 2025
- Medium-term fiscal challenges remain unaddressed (higher interest rates, rising debt relative to GDP and an ageing population)
- Exceptional Strengths Support Ratings:
- The US economy is expected to slip into a ‘mild recession’ by Q4
- Fitch expect the Fed to deliver another 25bp hike to take rates to 5.75%, due to a tight labour market and resilient economy
Has the US credit rating been downgraded before?
Yes. On August 5 2011, the United States lost its Triple-A credit status for the first time via Standard & Poor's (S&P) ratings agency. Citing large budget deficits, the political gridlock in Washington and a low economic recovery, the downgrade also came at a time when the US was facing a number of other challenges, including the European debt crisis and ongoing wars in Iraq and Afghanistan. They are yet to restore the original triple A rating, meaning two agencies have downgraded the US to AA+.
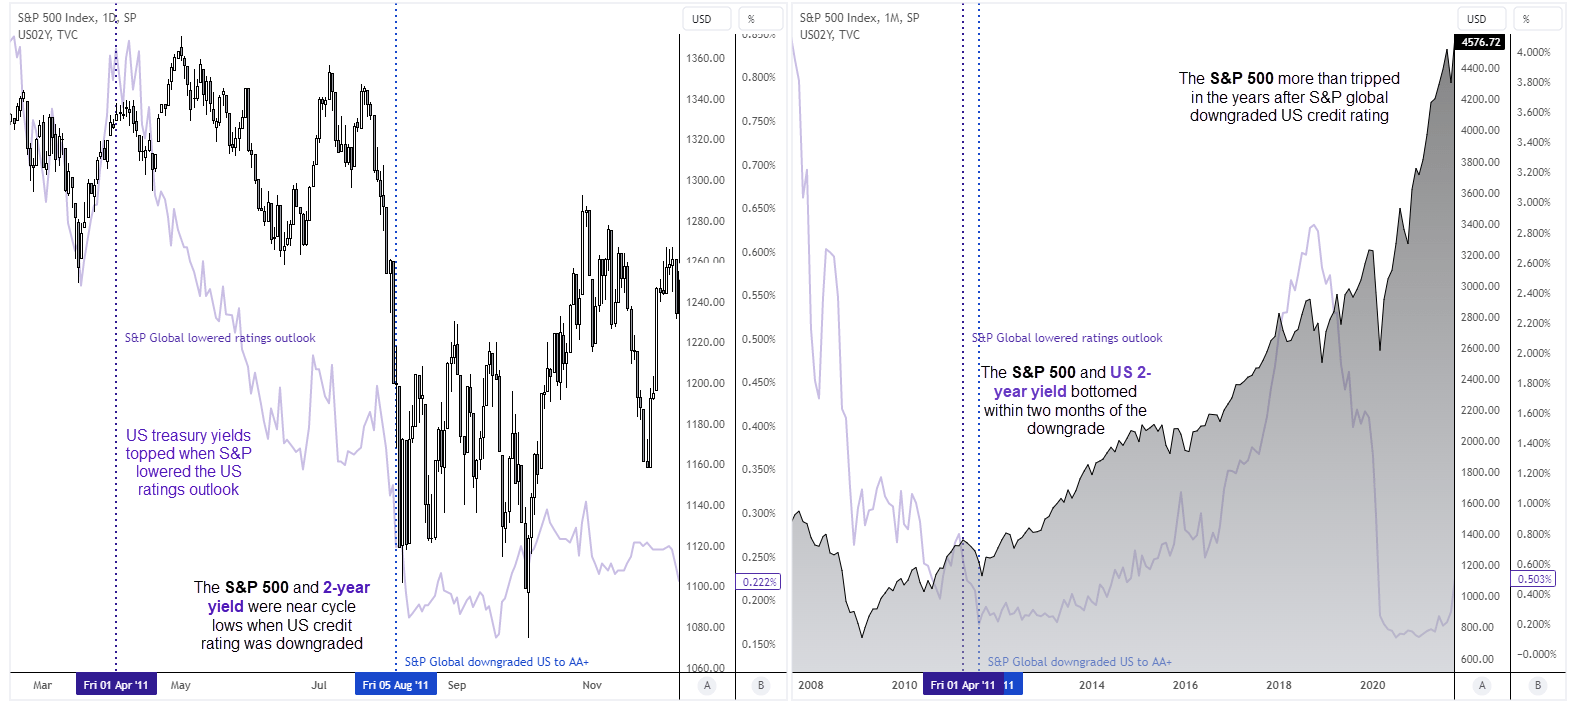
In theory, the downgrade could be significant as it signals to investors that the US government may be less likely to be able to repay its debts, as it essentially makes it more expensive for the US to service its debts. US treasuries topped in April 2011 when the S&P downgraded their outlook for the US. However, markets seemingly looked past any concerns as both the S&P 500 and US 2-year treasury yield troughed two months after the actual downgrade was announced in August. In fact, the S&P 500 went on to more than triple over the next 11 years and the 2-year yield is now at its highest level since 2007.
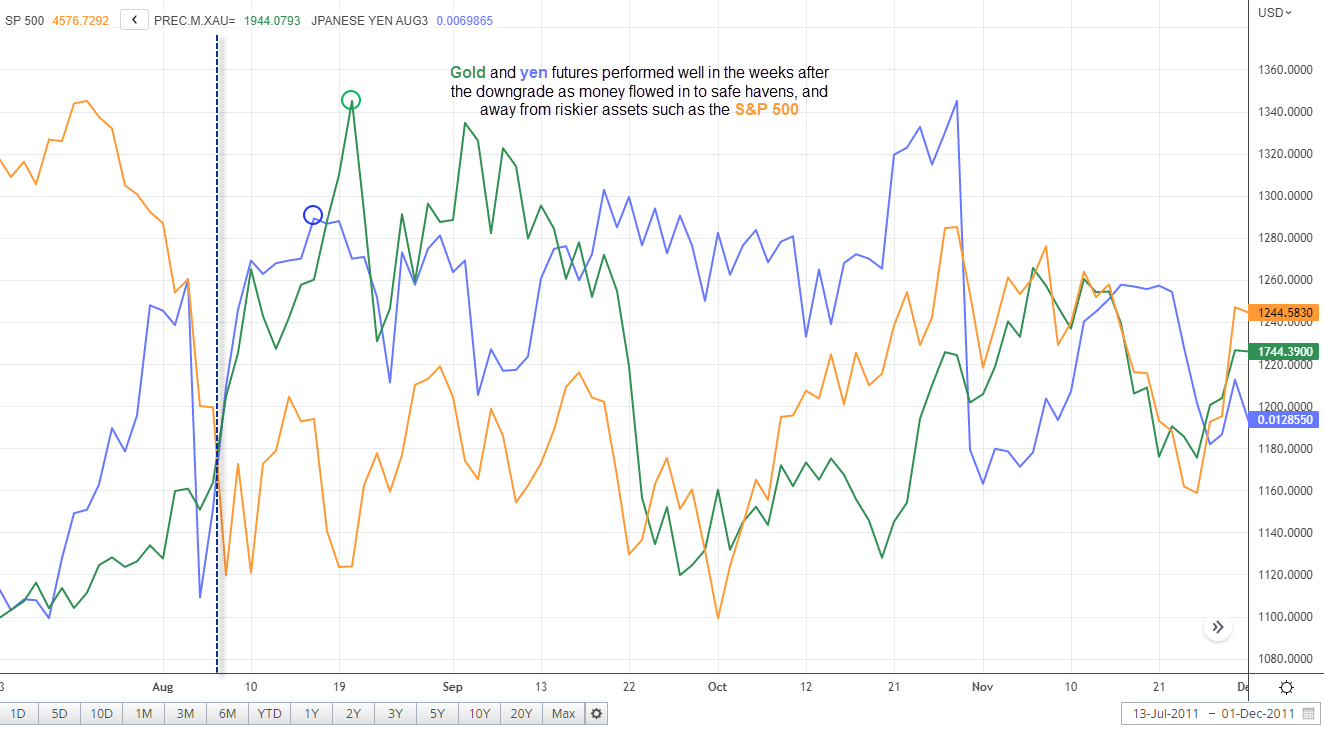
Taking a closer look, money flowed into safe-have markets such as the Japanese yen and gold over the next coupe of weeks. It could be argued that the fallout for the S&P 500 was limited overall as the market found an interim low two days after the announcement, but it did fall -6.5% the following day. So perhaps we’ll see some bearish follow through on the S&P 500 today.
As for Fitch’s downgrade, the muted response from markets reveals just how seriously they are taking Fitch’s downgrade. Which is not very seriously. Treasuries have hardly flinched, S&P 500 E-mini futures initially dropped a mere -0.6% and spot gold prices have picked themselves up from yesterday’s lows. Almost reluctantly.
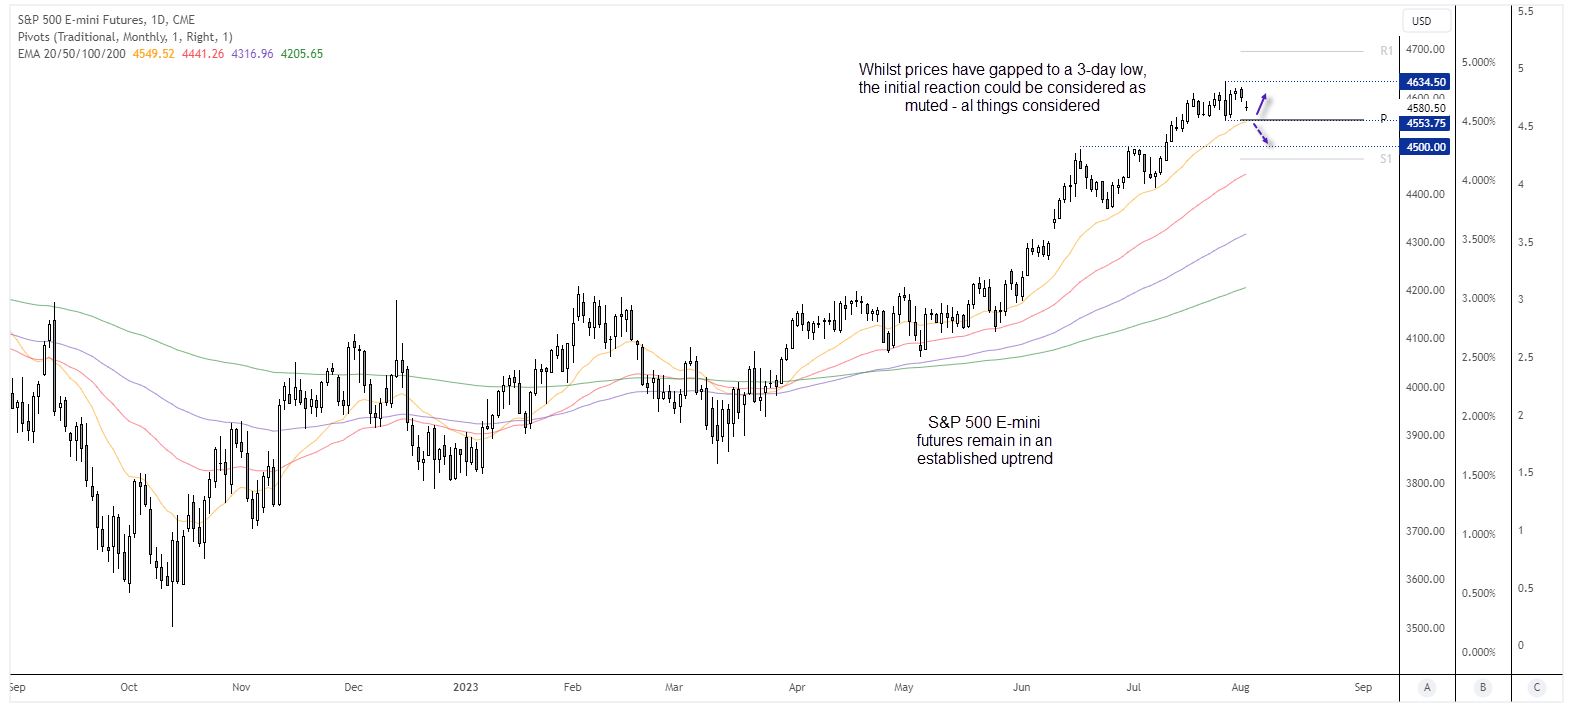
S&P 500 E-mini futures daily chart:
The daily chart shows that the S&P 500 E-mini futures remain in an established uptrend, with key moving average in ‘bullish sequence’ and fanning out to underscore bullish strength. That said, prices gapped down to a 3-day low to show sentiment has been knocked, but it is not exactly a bloodbath all things considered.
The monthly pivot point resides around the July 27 low, which brings the potential pullback to 4,553.75 on the cards – a break beneath which brings 4,500 into focus for bears. But if the initial reaction is anything to go by, a move towards the 4,553 low may tempt bulls back to the table for a punt within its current range.
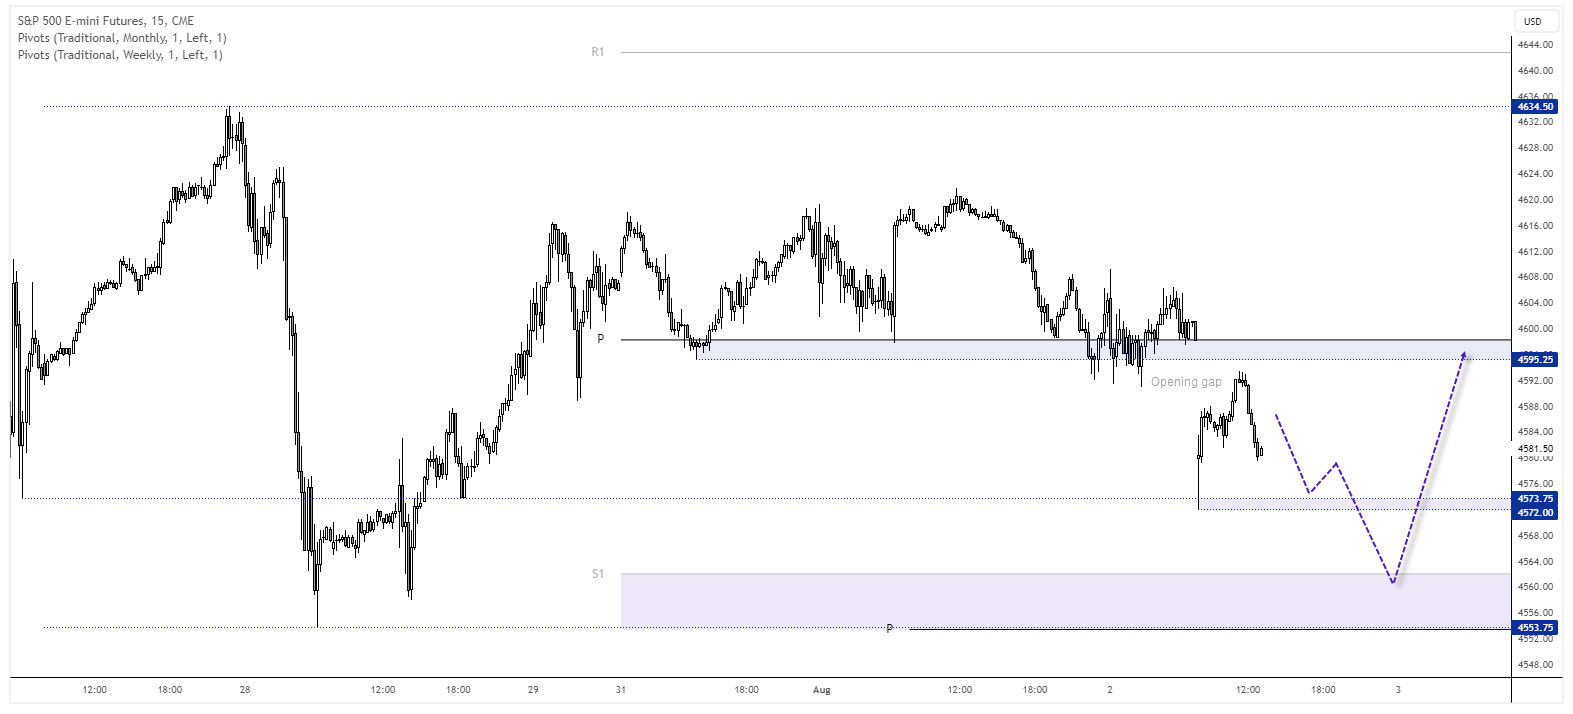
S&P 500 E-mini futures 30-minute chart:
Prices have tried but failed to close the opening gap, and as European or US traders are yet to react it’s plausible to expect another bout of selling during the coming session/s. The 4572 low makes a potential interim target, a break beneath which brings the lows around 4553 into focus, including the monthly pivot point and weekly S1 level. But, unless we see widespread panic, we suspect a bounce from the range lows could be in order and for prices to have another go at closing the opening gap.
-- Written by Matt Simpson
Follow Matt on Twitter @cLeverEdge
How to trade with City Index
You can trade with City Index by following these four easy steps:
-
Open an account, or log in if you’re already a customer
• Open an account in the UK
• Open an account in Australia
• Open an account in Singapore
- Search for the market you want to trade in our award-winning platform
- Choose your position and size, and your stop and limit levels
- Place the trade
Latest market news
Yesterday 01:32 PM
Yesterday 09:35 AM
Yesterday 07:23 AM
Yesterday 04:48 AM
Yesterday 12:17 AM
July 25, 2024 10:39 PM
Latest Trade Ideas articles

Yesterday 09:35 AM

Yesterday 12:17 AM

July 25, 2024 10:39 PM

July 25, 2024 05:30 PM