

US stock markets opened deep in the red and we haven’t seen any signs of a comeback just yet. The risks remain skewed to the downside, as selling momentum is rapidly growing. The S&P 500 forecast remains bearish, as things stand.
Before discussing why markets are falling, let’s take a look at the charts of the S&P 500.
Here, the weekly shows the index is turning lower from a key long-term inflection point circa 4140, a level which was previously support and resistance on several occasions. A decisive break below last week’s low would be a significant technical development.
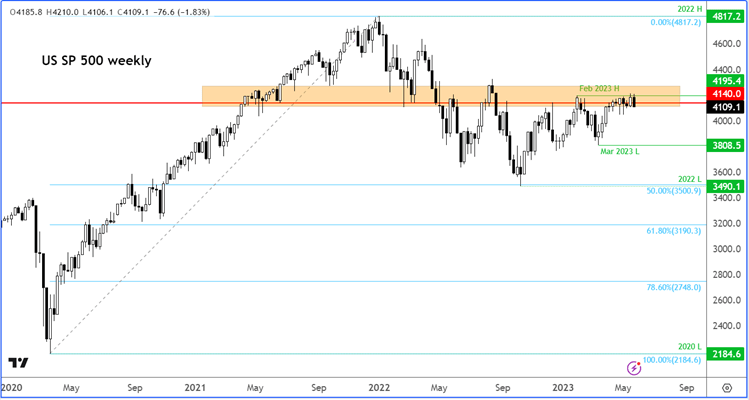
Source: TradingView.com
The daily chart of the S&P shows the index has already broken below a short-term bullish trend line and 21-day exponential moving average. A close below 4108 would create a short-term lower low. If that happens, then watch out below! In that case, a move down to 4050 would become highly likely, with the subsequent target being around 3990ish where the 200-day average meets the longer-term trend line.
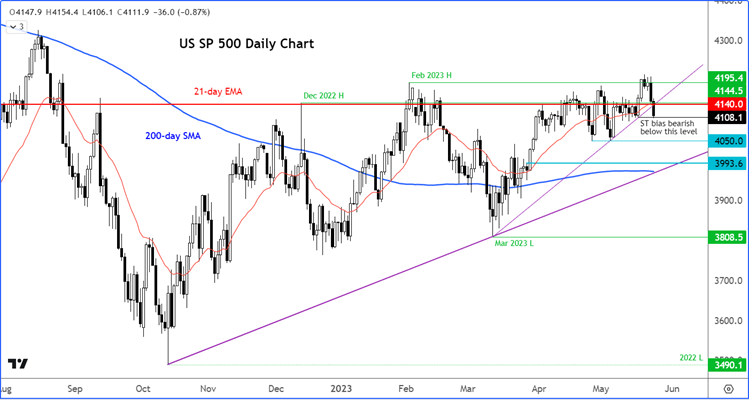
Source: TradingView.com
For the bulls, well there’s nothing to cheer right now and the best course of action for them is to sit on their hands and await a bullish reversal. It could be a long wait. A move above 4140 would be an ideal outcome for the bulls, as things stand.
Why are stocks falling?
Today’s losses come hot on the heels of a sharp sell-off on Tuesday, which carried on overnight in index futures along with Asian and European markets. Investors are awaiting the FOMC’s last meeting minutes, due to be released shortly. However, this is unlikely to be a catalyst behind a potential market recovery, as the focus remains firmly fixated on the US debt limit situation. A sell-off in the markets was always going to be needed to put pressure on the two sides to make a compromise. Negotiators are still far apart on key issues. They must act quickly to avert a default – and to stop the market turmoil. But have they left it all too late?
It is not just stocks. Sentiment towards nearly all risk assets has turned negative quite abruptly this week. Concerns are on the rise about the health of the Chinese and European economies and fears about the US debt ceiling. You also have a Fed still keen to tighten its policy further, while inflation in some parts of the world continues to remain very high, causing all sorts of problems and hurting the pockets of consumers. For example, the UK CPI eased less than expected to a still very high 8.7% in April. Businesses are not doing very well either, especially in the manufacturing sector, as we found out on Tuesday with those weak PMI numbers.
Stocks in Europe and China, copper and cryptos all sink
Earlier today we saw a sharp drop in shares of Europe’s top luxury brands, including Herms, LVMH and Kering, among others. This came on the back of a fresh drop in Chinese shares to a new low for the year. The selling meant the German DAX had now relinquished the entire sharp gains from last week in the space of just three days. Copper, too, hit a new low for the year, hurt by concerns about demand from China, the world’s top importers of base metals (and many other commodities).
Commodity dollars lead drop in FX
The risk off sentiment also filtered through the FX markets, causing commodity dollars to sink. Overnight the RBNZ hiked interest rate by 25 basis points, but the central bank also indicated that it is done with hiking, and this cause the NZD to drop sharply as traders priced out further rate hikes. The kiwi also took a hit because of the risk off trade weighing on all commodity dollars.
However, it wasn’t just ComDolls that struggled against the greenback. The pound and euro also fell, albeit the losses were contained. This morning saw inflation data come in stronger from the UK but this failed to provide any meaningful support for the GBP/USD, with the cable turning lower shortly after to drop to a new low on the week.
-- Written by Fawad Razaqzada, Market Analyst
Follow Fawad on Twitter @Trader_F_R
How to trade with City Index
You can trade with City Index by following these four easy steps:
-
Open an account, or log in if you’re already a customer
• Open an account in the UK
• Open an account in Australia
• Open an account in Singapore
- Search for the company you want to trade in our award-winning platform
- Choose your position and size, and your stop and limit levels
- Place the trade
Latest market news
Yesterday 01:32 PM
Yesterday 09:35 AM
Yesterday 07:23 AM
Yesterday 04:48 AM
Yesterday 12:17 AM
July 25, 2024 10:39 PM
Latest Trade Ideas articles

Yesterday 09:35 AM

Yesterday 12:17 AM

July 25, 2024 10:39 PM

July 25, 2024 05:30 PM