

Wall Street indices continue to defy the doomsdayers, having posted solid gains in the first half of the year. And that is despite inflation remaining relatively high, and US economic data outperforming overall to justify a hawkish Fed.
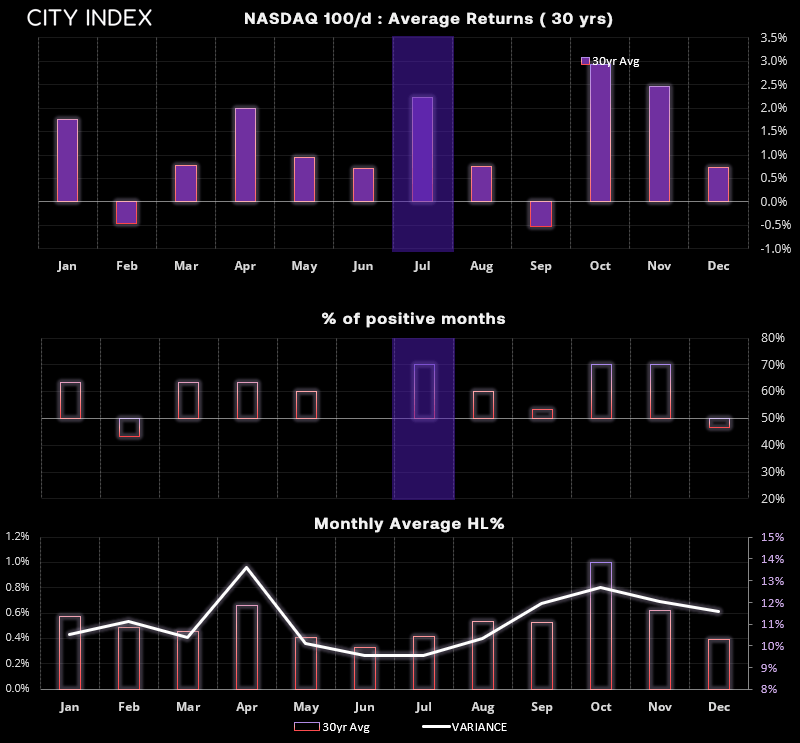
But Fed members have been slightly less hawkish this week, essentially reminding us that we’re close to the end of the tightening cycle. And if US inflation on Wednesday were to treat us all to a softer-than-expected data set, it could spark the next leg higher for equity markets. And as the Nasdaq is the clear outperformer of the bunch, we’d back if for longs in the second half of this year – taking comfort that July has been a bullish month on average for the Nasdaq over the past thirty years. Its 70% ‘win rate’ (bullish months verses bearish) is also a healthy 70%.
But let’s not get ahead of ourselves. Inflation remains highs by historical standards. And if doesn’t decelerate fast enough, it simply provides the green light for further hikes and that could take the wind out of bullish sales for US indices.
As things stand, we’re in one of the least volatile months of the year according to seasonality. And as we’re heading into earnings season we could find ranges remain tight and unexciting over the near-term. But if current market conditions can be identified, and future condition be anticipated, trades can adapt their trading cycles accordingly.
Nasdaq 100 daily chart:
The Nasdaq 100 has risen 38% YTD. And whilst many will be quick to point out that its rally has been supported by the outperformance of a select few equities, ~75% of its constituents have in fact posted gains this year (even if only marginal by comparison). In fact, ~35% of the Nasdaq 100 has posted YTD gain over 30% so all is not terrible in a world of high inflation with a hawkish Fed all things considered. And with 20% gains arriving between Q2’s low to high, a pause in trend isn’t such a bad idea.
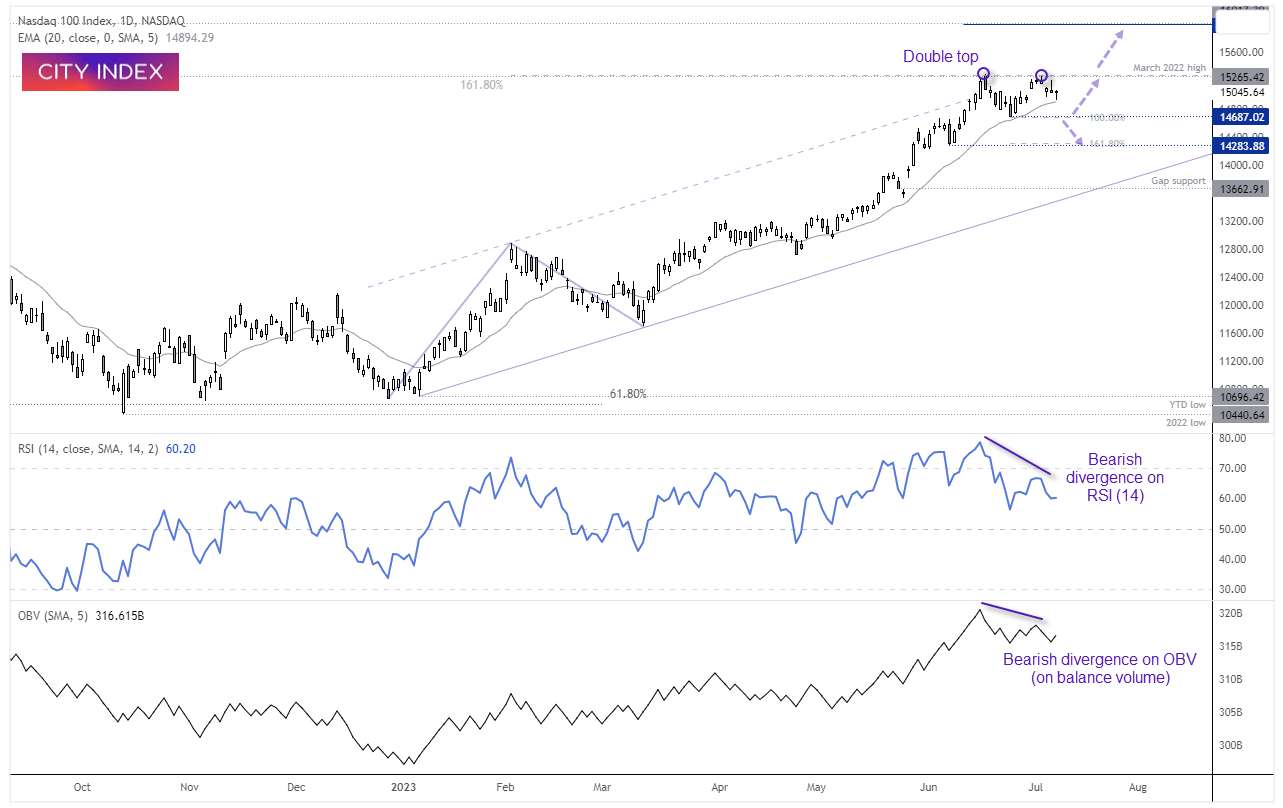
The daily chart shows a strong bullish trend which almost perfectly met a 161.8% Fibonacci ratio and March 2022 high. The 20-day EMA has provided support in recent months, although the June and (current) July high form a double top, which could continue to provide resistance unless a fresh bullish catalyst arrives. And whilst the OBV (on balance volume) has mostly trended higher with price action this year, it has now formed a bearish divergence with prices as the OBC has not retested its own cycle high like price action has. Furthermore, a bearish divergence has formed on the RSI (14).
Given the US summer, lower levels of volatility associated with it and a slew of earnings data set to arrive, we suspect trading the index could cause some frustration on the daily chart as it may lack the legs to provide a strong rally in either direction. We therefore favour intraday trades between key levels of support, resistance and gaps. But we would happily switch to a bearish view should sentiment sour and volatility return whilst we trade beneath the March 2022 high.
- A break above the March 2022 highs assume a resumption of the bullish trend
- Without a bullish / risk-on catalyst, bears may seek to fade into low volatility moves beneath the March 2022 high
- Trend traders may prefer to either seek bullish setups around support levels (such as 14,687) or wait for a bullish breakout
- A break beneath 14,687 assumes a deeper correction is underway
Apple (AAPL) daily chart:
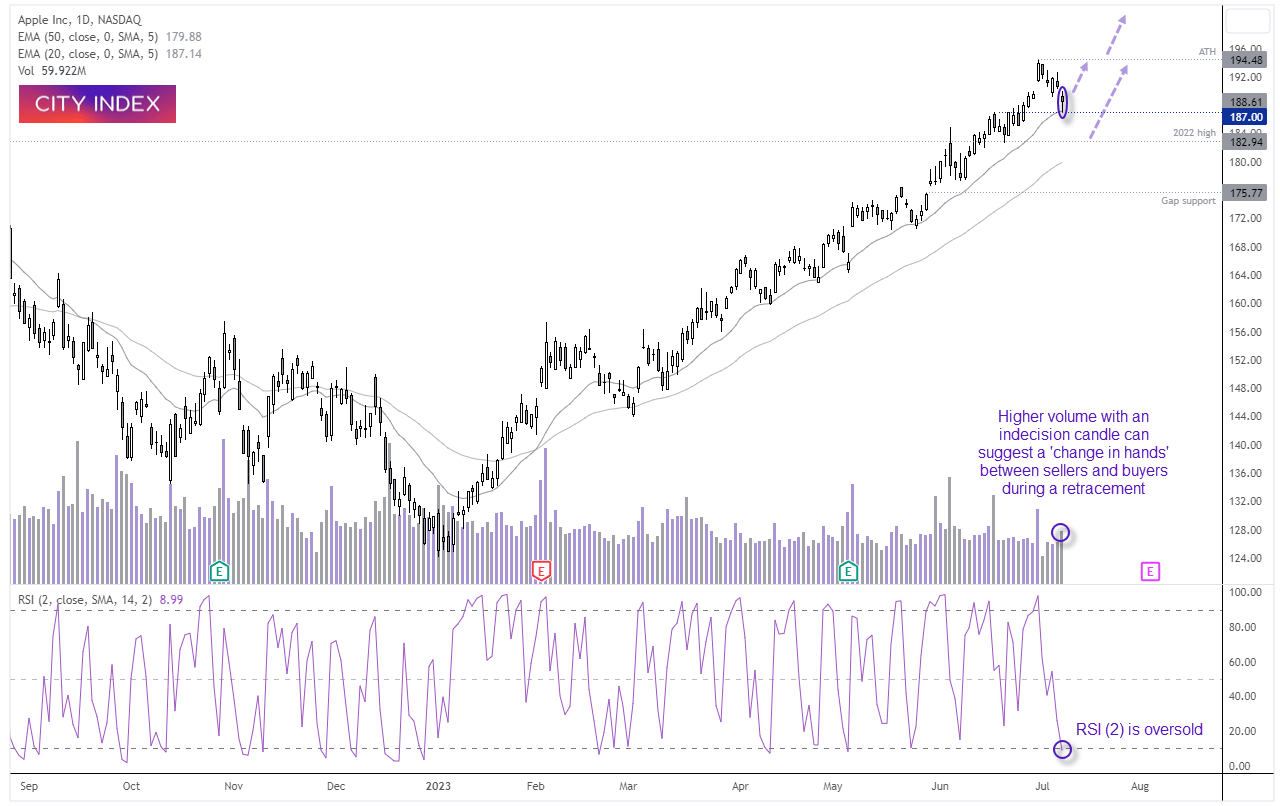
The daily trend structure remains firmly bullish on Apple, with the stock happily bouncing along the 20-day EMA on its way to fresh highs. Retracements have been timely but shallow, and prices have pulled back to the 20-day EMA once more.
Whilst the daily trading volume rose to a a five-day high yesterday, the fact it occurred with a Spinning Top Doji suggests a ‘change in hands’ between bears to bulls after a five-day retracement. Furthermore, RSI (2) has just dipped into the oversold zone below 10 to warn of a potential inflection point over the near-term. Therefore, a swing low could be near if it hasn’t formed already.
- Bulls could seek to enter a break above Monday’s high (190.15) and retain a bullish bias above 187 ovr the near-term
- 195 / the all-time high could be the intial target, with an open target in mind should prices break higher
- A move below 187 brings the 2022 high in focus around 182.64
-- Written by Matt Simpson
Follow Matt on Twitter @cLeverEdge
How to trade with City Index
You can trade with City Index by following these four easy steps:
-
Open an account, or log in if you’re already a customer
• Open an account in the UK
• Open an account in Australia
• Open an account in Singapore
- Search for the market you want to trade in our award-winning platform
- Choose your position and size, and your stop and limit levels
- Place the trade
Latest market news
Yesterday 01:32 PM
Yesterday 09:35 AM
Yesterday 07:23 AM
Yesterday 04:48 AM
Yesterday 12:17 AM
July 25, 2024 10:39 PM
Latest Trade Ideas articles

Yesterday 09:35 AM

Yesterday 12:17 AM

July 25, 2024 10:39 PM

July 25, 2024 05:30 PM