July 11, 2022 8:31 PM

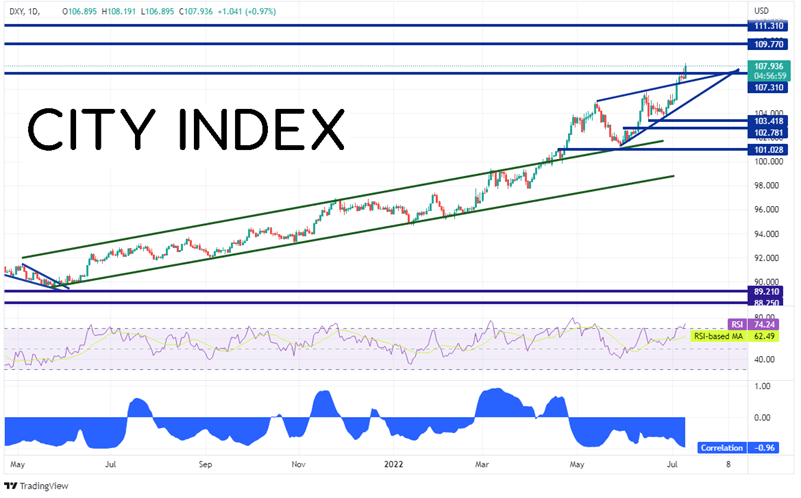
The US Dollar Index (DXY) continues to soar as today it reaches its highest level since October 2002 near 108.19. Expectations are for a strong CPI print on Wednesday, which may all but cement a 75bps interest rate hike by the FOMC when gathers at its July Interest Rate decision meeting on July 26th-27th. As a result, the DXY continues to push higher on the back of higher expected interest rates.
Everything you should know about the US Dollar Index
The US Dollar Index had been moving higher since May 2021 in an orderly channel. However, in April of 2022, it became more apparent the Fed would be raising rates faster than it had previously thought. The DXY broke above the channel and shot from nearly 100 to roughly 105 in a month! The US Dollar Index then pulled back to 101.30 and then moved higher in an ascending wedge formation. Expectations are that price breaks lower out of an ascending wedge, however, on July 6th price broke above the top, rising wedge of the pattern and is continuing higher today! Horizontal resistance sits above at the September 2002 highs of 109.77 and the lows of September 2001 at 111.31. However, notice that the RSI is in overbought territory, indicating that this may be a false breakout higher. If the DXY pulls back into the channel, support is at the upper trendline of the wedge near 106.65, then the bottom trendline near 104.65. Below there, the DXY can fall to the lows of June 16th near 103.50.
Source: Tradingview.com, Stone X
Trade the DXY now: Login or Open a new account!
• Open an account in the UK
• Open an account in Australia
• Open an account in Singapore
Notice the correlation at in the bottom panel of the chart above. The correlation coefficient shows how 2 assets are correlated with each other. The correlation coefficient between the DXY and Gold (XAU/USD) is -0.96. A reading of -1.00 means that there is a perfect negative correlation between 2 assets and that they move in opposite directions 100% of the time. -0.96 is a very strong negative correlation! Therefore, when the DXY moves in one direction, Gold moves in the opposite direction. Note that the correlation is only related to the direction of the move, not the magnitude of the move.
Trade Gold now: Login or Open a new account!
• Open an account in the UK
• Open an account in Australia
• Open an account in Singapore
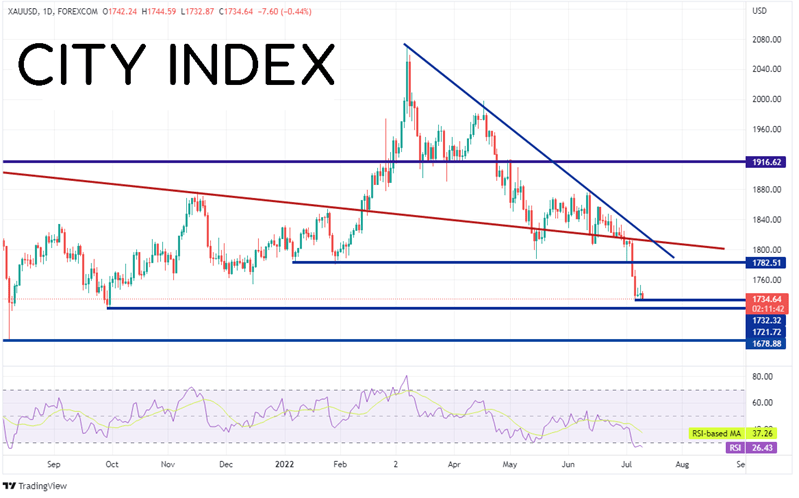
As the DXY continues to push higher on the daily timeframe, XAU/USD continues to push lower. Today, spot gold tested July 5th’s low of 1732.32, its lowest level since September 30th, 2021. If the DXY continues to move higher, Gold is likely to move lower. The first support level is just below at the lows of September 29th, 2021 at 1721.72. Below there, price can fall to the lows from August 9th (and a triple bottom) at 1679.13. However, notice that the RSI in Gold is in oversold territory (just as the DXY was in overbought territory). If Gold (and the DXY) reverses, first horizontal resistance isn’t until 1782.51. Above there, price can move to the highs of July 5th, which also converges with a long-term, downward sloping trendline (red) dating to September 1st, 2020. The downward sloping trendline from the recent highs on March 8th is the next line of resistance near 1830.
Source: Tradingview.com, Stone X
The US Dollar Index has been moving aggressively higher since mid-spring. Over that same timeframe, Gold has been moving lower. The two assets currently share a correlation coefficient of -0.96, a very strong negative correlation. Therefore, if the DXY continues to move higher, one could suspect that XAU/USD will be moving lower!
Learn more about forex trading opportunities.
Latest market news
Yesterday 01:32 PM
Yesterday 09:35 AM
Yesterday 07:23 AM
Yesterday 04:48 AM
Yesterday 12:17 AM
July 25, 2024 10:39 PM
Latest Forex articles

Yesterday 12:17 AM

July 25, 2024 10:39 PM

July 25, 2024 03:59 PM

July 25, 2024 04:37 AM