February 9, 2023 5:05 PM

Mexico’s CPI released earlier today showed that January inflation increased to 7.91% YoY vs an expectation of 7.89% YoY and a prior reading on 7.82% YoY. Note that the CPI print rose for the second month in a row after a large drop from September 2022 at 8.7% YoY. In addition, the Core inflation rate increased to 8.45% YoY vs an expectation of 8.41% YoY and a prior reading of 8.35% YoY. Core inflation is approaching cycle highs from November 2022 at 8.51% YoY. The Bank of Mexico (Banxico) meets later today and is expected to hike rates by 25bps to bring the benchmark policy rate to 10.75%, which would be the 14th consecutive hike in rates. However, after a drop in inflation in Q4, CPI is on the rise again. The Bank of Mexico has been mirroring the Fed’s rate hikes since June 2022. But one must consider that Banxico may have to do more with its inflation beginning to rise again.
On a weekly timeframe, USD/MXN has been moving lower since making pandemic highs in early April 2020 at 25.7836. The pair had been making lower highs, while it held support between roughly 19.50 and 19.75 from late November 2020 to late December 2022. USD/MXN finally broke aggressively below the support level in early January and reached support at the prior lows from just before the pandemic began in February 2020 near 18.5235.
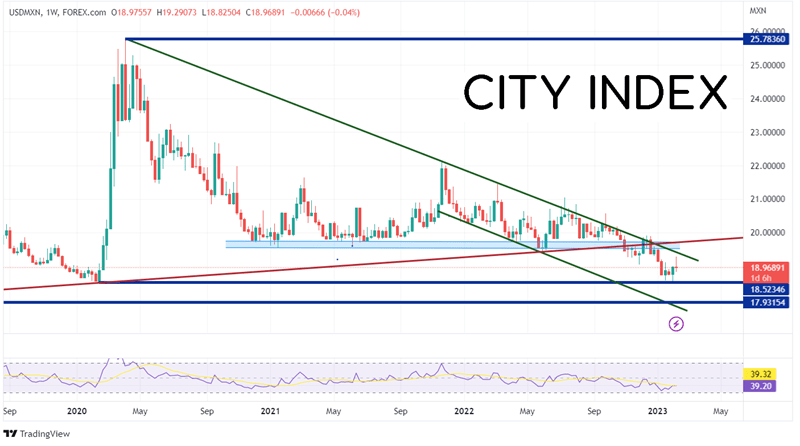
Source: Tradingview, Stone X
Trade USD/MXN now: Login or Open a new account!
On a daily timeframe, USD/MXN formed a channel within the falling triangle, and the pair still remains in it as price has pushed below the triangle. USD/MXN tested the 18.5235 level twice since January 15th and bounced each time. On February 6th, the price pierced the 50 Day Moving Average but fell back below it. USD/MXN has been trading in a range between 18.5081 and 19.2907 since.
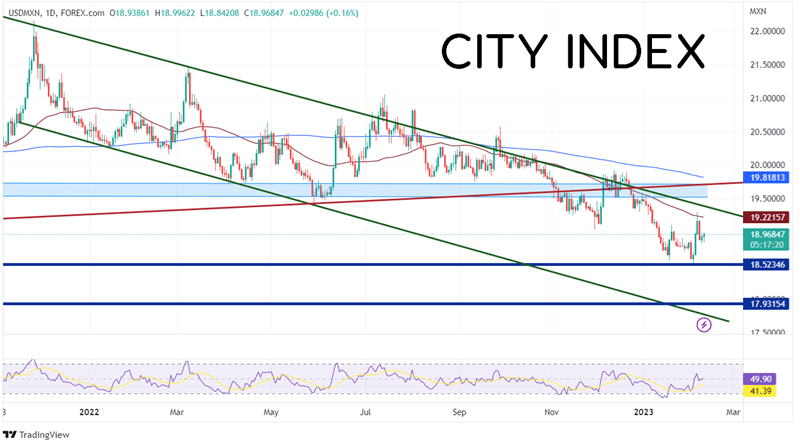
Source: Tradingview, Stone X
The Bank of Mexico meeting could decide the next move of USD/MXN. If there is a dovish hike, the pair could test the recent highs at 19.2907, then the bottom of the previous support zone at 19.5205. Just above the range sits the 200 Day Moving Average at 19.8183. However, if the central bank hikes with an indication that there is more to come, USD/MXN could take out the recent lows. Below there, price can fall to the lows of February 2020 at 17.9315, then the bottom trendline of the channel near 17.7550.
With inflation on the rise once again in Mexico, will Banxico deliver a hawkish 25bps hike? If so, if may mean new lows for USD/MXN. Below 18.5081 the pair could be on its was to 17.9315! Manage risk accordingly.
Learn more about forex trading opportunities.
Latest market news
Yesterday 01:32 PM
Yesterday 09:35 AM
Yesterday 07:23 AM
Yesterday 04:48 AM
Yesterday 12:17 AM
July 25, 2024 10:39 PM
Latest Trade Ideas articles

Yesterday 09:35 AM

Yesterday 12:17 AM

July 25, 2024 10:39 PM

July 25, 2024 05:30 PM