February 1, 2022 4:46 PM

In Europe, the Market Manufacturing PMI is considered the most watched indicator for manufacturing and services activity. The survey is released as a preliminary reading near the 20th of each month and a final reading on the 1st of each month. However, in the US, the ISM Manufacturing PMI is considered the leader for watching manufacturing and services PMI data. For January, the headline print was 57.6 vs 57.5 expected and 58.7 in December. The headline print was weaker than December’s print due primarily to the New Orders Component (57.9 vs 61 in December). However, markets know that what the Fed really cares about right now is the inflation component. The January ISM Manufacturing Prices was 76.1 vs 68.1 expected and 68.2 in December.
Forecasting 2022 inflation: Transitory no more?
Recall that from the FOMC press conference, Fed Chairman Powell talked excessively about inflation and the possibility of raising interest rates at the March meeting. He noted how the “Committee is of a mind to raise rates at the March meeting”. He also noted that “We are not making progress on the supply chain issue”. See our complete FOMC recap here. In addition, over the last few days, no fewer than 4 Fed members have been speaking about raising rates in March. Philadelphia Fed President Harker even suggested there is even the possibility of a 50bps rate hike if there is another spike in inflation, though he’s less convinced of that now.
Everything you need to know about the Federal Reserve
EUR/USD has been in a downward sloping channel dating to May of 2021. The pair briefly broke below the channel in late November 2021 and traded sideways back into the channel, only to test the topside in mid-January. The range of the sideways pattern in December 2021 and January 2022 had been mostly contained between 1.1235 and 1.1375. (green lines). On January 27th, EUR/USD broke below the channel and below the November 24th lows at 1.1186. However, with the doji candle on January 28th, and the long green candle on January 31st, a morning star formation has been formed. This is a bullish reversal pattern.
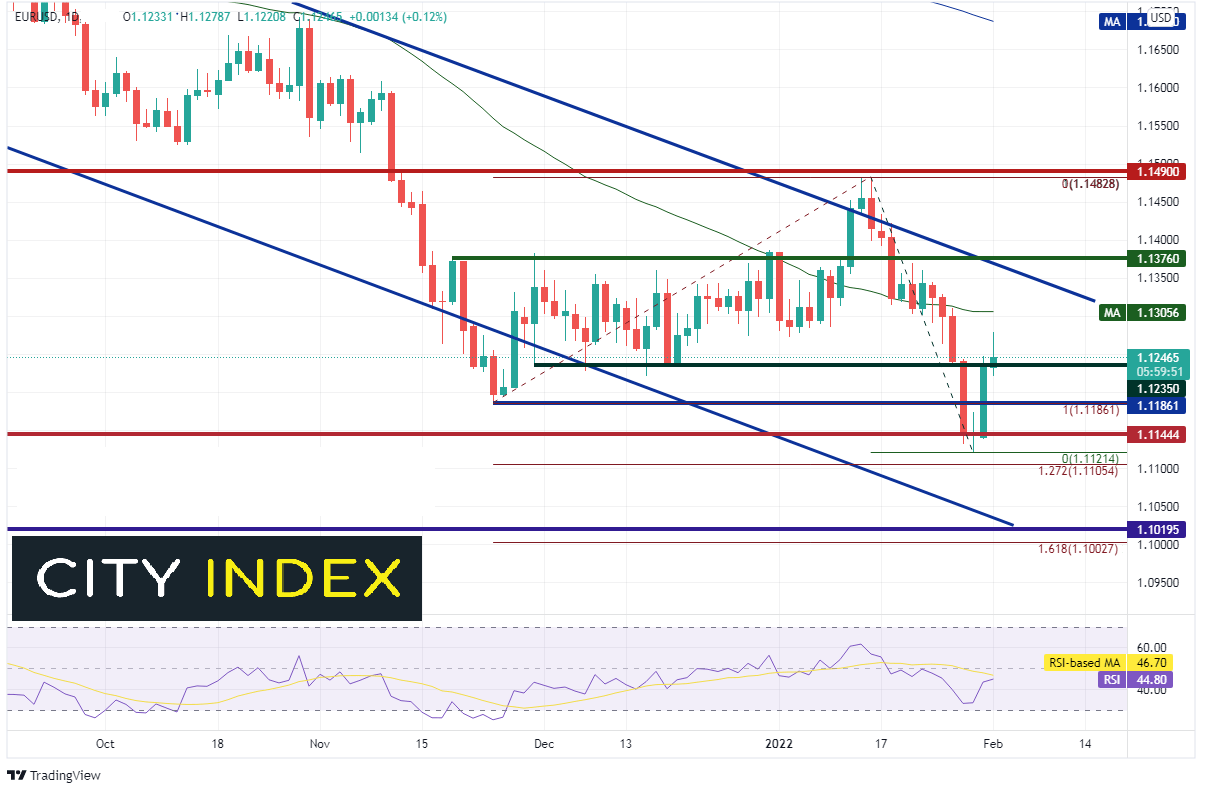
Source: Tradingview, Stone X
On the 240-minute timeframe, horizontal resistance sits just above current levels at 1.1274, then a confluence of resistance at the 50 Day Moving Average (see daily chart) and the 50 % retracement level from the highs of January 14th to the lows of January 28th, near 1.1302/1.1305. Above there, resistance is at the 61.8% Fibonacci retracement level from the same timeframe near 1.1345. Horizontal support is below 1.1173 then the recent lows at 1.1121. If price breaks below there, the next support level is 1.1105, which is the 127.2% Fibonacci extension from the November 24th, 2021 lows to the January 14th highs.
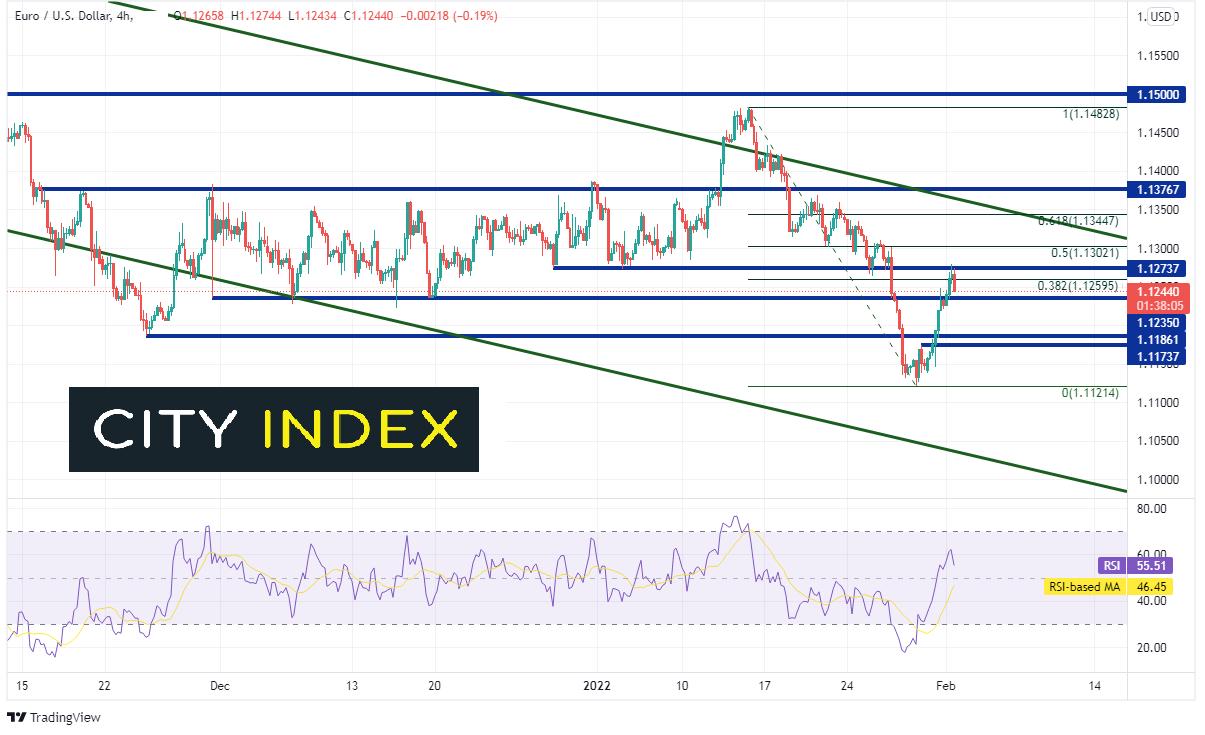
Source: Tradingview, Stone X
US inflation has been high, and the Fed is on the lookout for clues as to when inflation will begin to pullback. Although the ISM Manufacturing PMI was weaker than December, the inflation component was higher. The Fed will have to continue its search for lower inflation elsewhere.
Learn more about forex trading opportunities.
Latest market news
Today 01:00 PM
Yesterday 01:32 PM
Yesterday 09:35 AM
Yesterday 07:23 AM
Yesterday 04:48 AM
Latest Trade Ideas articles

Yesterday 09:35 AM

Yesterday 12:17 AM

July 25, 2024 10:39 PM

July 25, 2024 05:30 PM