

Not even gold is able to decouple itself from the ongoing bond market rout or the rallying US dollar. The precious metal has started the new week how it ended the last three: on the backfoot. Despite the sharp continuation of sell-off in equity markets, there were no signs of any serious haven demand buying of the precious metal by mid-morning London session.
Gold has been struggling because it is a non-interest-bearing commodity. Unlike government bonds and stocks, it doesn’t give interest or dividends, and costs money to store. So, as yields on government debt continue to press higher, investors are forced to get out of assets that pay low or – in the case of gold – no interest or dividend.
Granted, the 3% or so yield you get on the US 10 year is nowhere near enough to offset the cost of inflation, it is nonetheless better than for example the dividend yield provided by the overvalued US technology sector, which has been fuelled by years of money printing by major central banks.
Yields have been on the rise as the era of extraordinary loose monetary policy comes to an end – at least for a while anyway – as rising price pressures force the Fed to raise interest rates and reduce its holding of government debt. It is precisely this reason why stocks as well as gold and silver have struggled, even though the latter are meant to offer protection from inflation. Price pressures could worsen in the near term as China’s Covid lockdowns undermined production and disrupt logistics. The latest trade data from the world’s second-largest economy showed export growth in April slowed to its weakest pace since June 2020, to 3.9% from a year earlier, compared to an increase in March of 14.7%, in dollar terms.
Gold has now given up nearly all of its gains made between February and March and was now up just under 1.9% in the positive territory year-to-date. The price of gold in euros is up 10% year-to-date and even higher in pound (+11%) and yen (+16%) terms.
So, the fact that it has been able to withstand the dollar’s impressive rally to some degree, goes to show that there must be at least some demand for gold from those seeking to protect their wealth being eroded by inflation and from holding fiat currencies. For this reason, I remain cautiously optimistic on the long-term outlook for the precious metal. When the bond market rout stops, that’s when gold and silver will probably rise from the ashes again and shine brightly. It might take a while, though, as investors continue to price in future monetary policy tightening.
Gold’s recent breakdown below $1900 support has paved the way for a potential drop to the next technically important zone around $1830. This is where the 200-day moving average meets a bullish trend line, the point D of an AB=CD price projection, and the 61.8% Fibonacci retracement against the rally from August. So, I would expect a bounce of some sort there, but would only turn bullish on gold again when we have a higher high in place (as things stand, the most recent high was made at just below $1920).
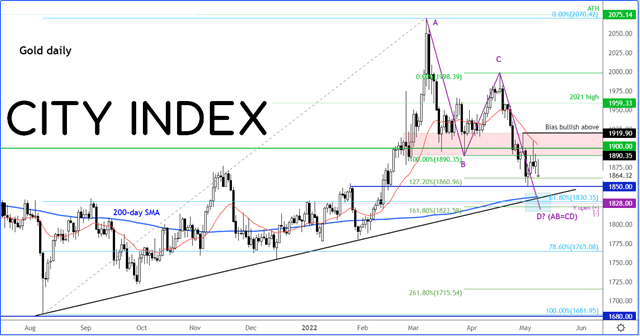
Source: StoneX and TradingView.com
How to trade with City Index
You can trade with City Index by following these four easy steps:
-
Open an account, or log in if you’re already a customer
• Open an account in the UK
• Open an account in Australia
• Open an account in Singapore
- Search for the company you want to trade in our award-winning platform
- Choose your position and size, and your stop and limit levels
- Place the trade
Latest market news
Yesterday 01:32 PM
Yesterday 09:35 AM
Yesterday 07:23 AM
Yesterday 04:48 AM
Yesterday 12:17 AM
July 25, 2024 10:39 PM
Latest Trade Ideas articles

Yesterday 09:35 AM

Yesterday 12:17 AM

July 25, 2024 10:39 PM

July 25, 2024 05:30 PM