July 29, 2021 4:40 PM
Gold and Silver bid after FOMC, but how much higher will they go?
Precious metals have been moving higher after the FOMC press conference in which Fed Chairman Powell indicated that they were “a long ways away” from “substantial further progress”. (See our complete FOMC recap here) The FOMC statement, which was less dovish (even slightly hawkish), noted that the “the economy has made progress towards goals in tapering”. These 2 comments together told the story of a central bank that has tapering bond purchases on its radar screen but sees it way out in the distance. Traders are taking this to mean that extraordinary accommodative stimulus will continue, for now.
Everything you need to know about the Federal Reserve
As such, the US Dollar has moved lower and, as a result, Gold and Silver have moved higher. But how much more do they have to go on the upside before a pullback. On a daily Gold (XAU/USD) chart, we can see that the precious metal recently pulled back and formed a double bottom at the 61.8% Fibonacci retracement level from the double bottom at 1678 in March to the high on June 1st at 1916. The longer-term downward sloping trendline from the August 7th all-time highs has acted as resistance before. In mid-July, that, along with the 200 Day Moving Average, were enough to cause Gold to dip back below the trendline. However, after the FOMC press conference, Gold busted through the trendline, the 200 Day Moving Average and is up against horizontal resistance at 1834.
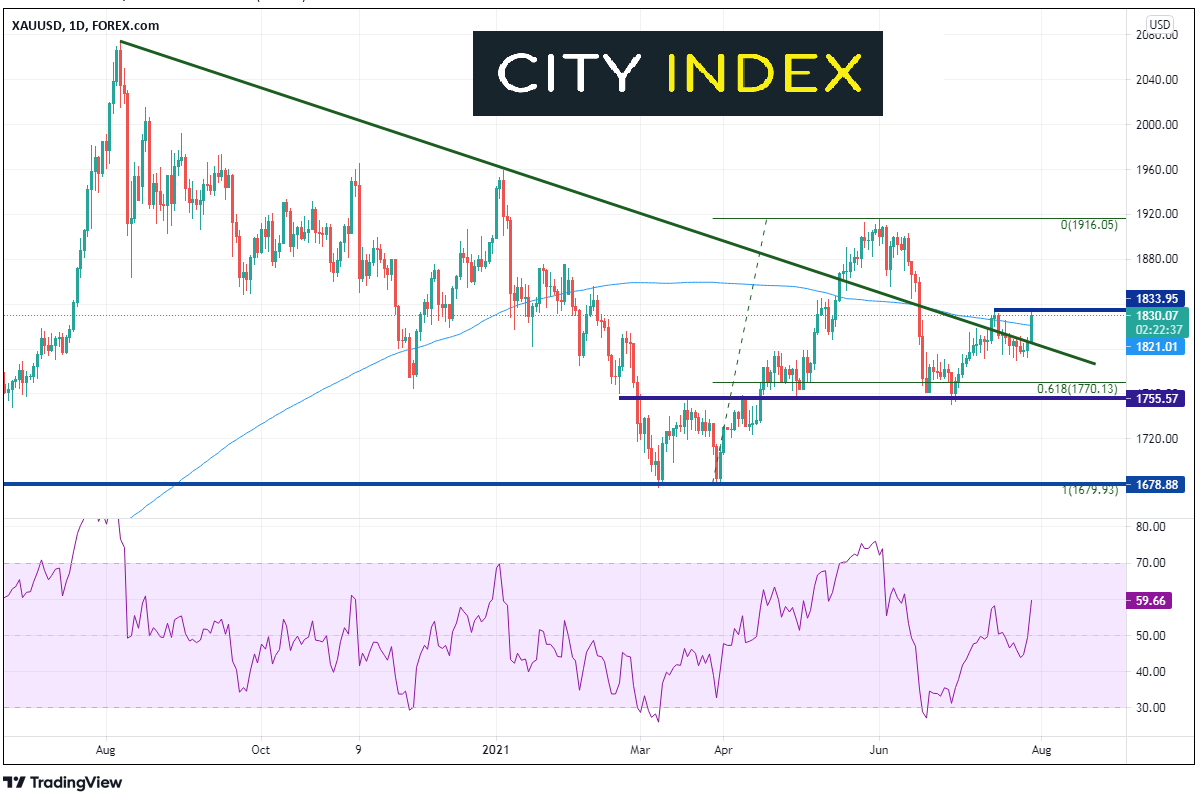
Source: Tradingview, City Index
In addition, on a shorter 240-minute timeframe, price is up against the 50% retracement from the June 1st highs to the June 29th lows, while the RSI is in overbought territory. If the precious metal does pull back from current resistance, the 200 Day Moving Average is just below at 1821 (see daily). Additional support is at the long-term trendline (also on daily) near 1806. Horizontal support is just below at 1790.
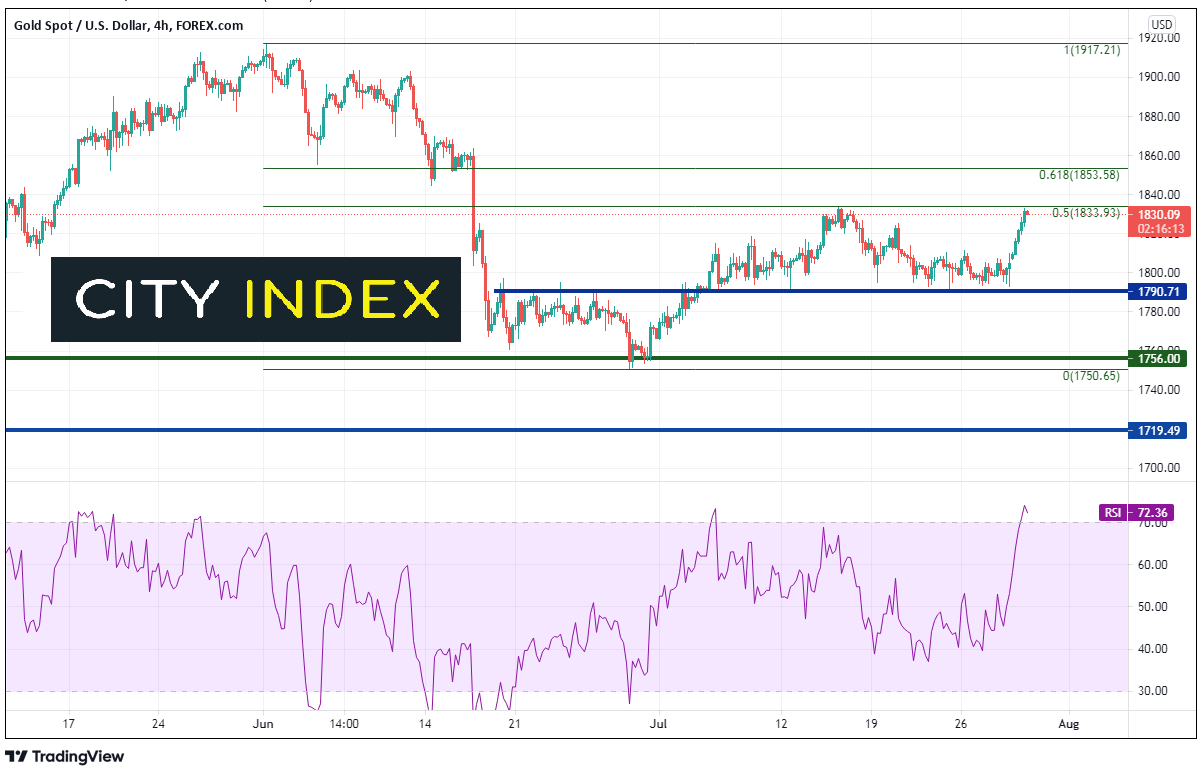
Source: Tradingview, City Index
Silver has been in a symmetrical triangle since the highs on August 7th (the same day as Gold made new highs). Price pulled back and held the 61.8% Fibonacci retracement level from the low on November 30th, 2020 to the high of February 1st near 25.00 and held. Since July 20th, the precious metal has been oscillating around the bottom trendline of the symmetrical triangle and horizontal support between 24.50 and 25.00. Today, Silver moved back above the trendline, horizontal resistance and the 200 Day Moving Average near 25.88. There is also horizontal resistance near that level. Above there is more horizontal resistance at 27.03 and then the downward sloping trendline from the triangle near 28.30. Near term support is at the triangle trendline near 25.20, followed by Tuesdays lows at 24.50. The next level of support isn’t until the March 30th lows at 21.86.
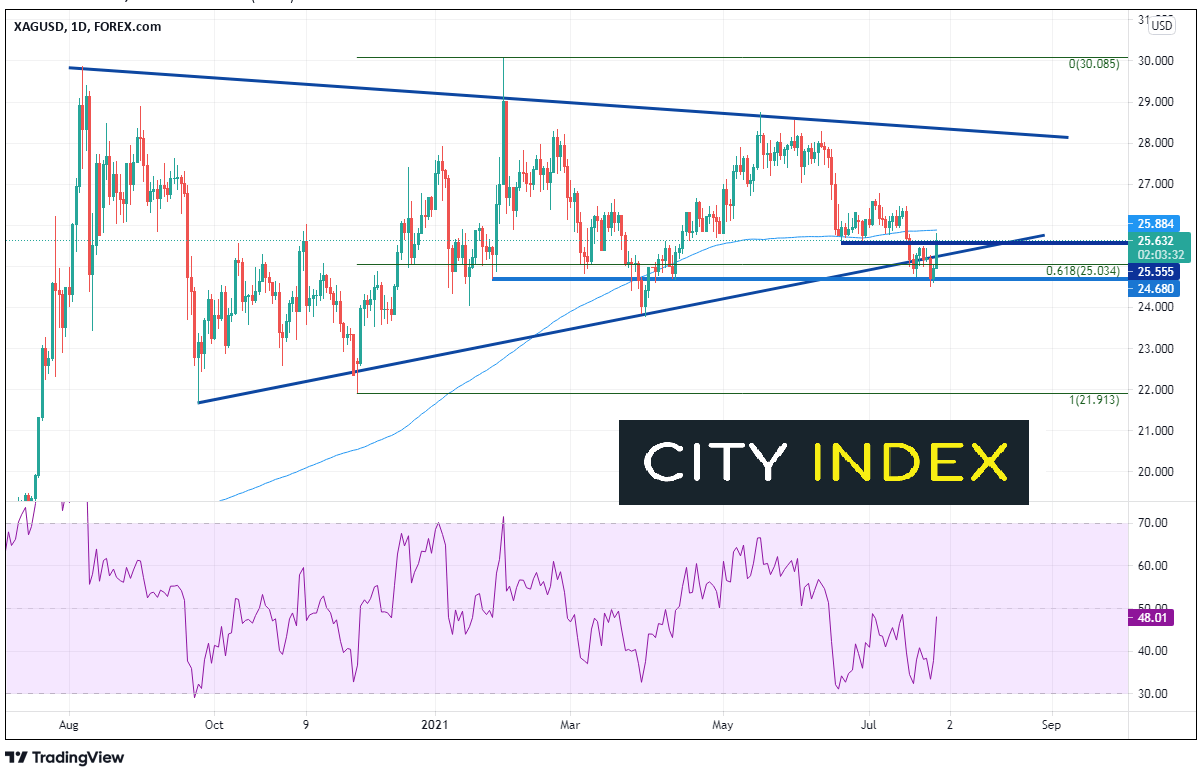
Source: Tradingview, City Index
Both Gold and Silver on been on a one-way move higher since the FOMC meeting. However, they are both running into resistance. Bulls will be looking for dips to buy the precious metals as bears will be looking to sell at resistance levels. Watch for more two-way action as we head into month-end.
Learn more about gold and silver trading opportunities
Latest market news
Yesterday 01:32 PM
Yesterday 09:35 AM
Yesterday 07:23 AM
Yesterday 04:48 AM
Yesterday 12:17 AM
July 25, 2024 10:39 PM
Latest Forex articles

Yesterday 12:17 AM

July 25, 2024 10:39 PM

July 25, 2024 03:59 PM

July 25, 2024 04:37 AM