January 11, 2022 9:00 PM

The yield on the US 10-Year Treasury Note reached 1.808% yesterday, its highest level since January 2020 (pre-pandemic). However, this isn’t the only yield in town making new highs. Today, the German Bund reached a high of -0.014%, just ticks below the psychological round number resistance level of 0.00%. This is also the highest level the Bund yield has reached since May 2019! Yields had already been moving higher since making a near term low on December 8th, 2021 at -0.395. And since December 20th, 2021, the yield has only had two down days!
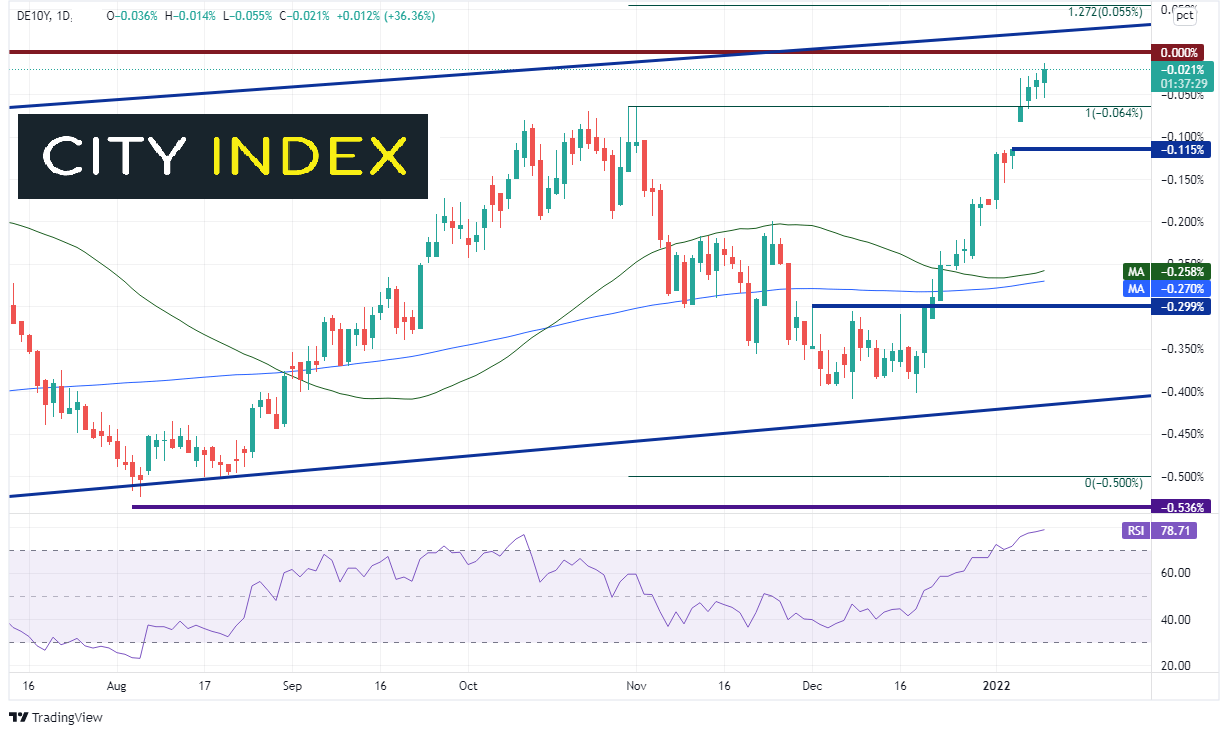
Source: Tradingview, Stone X
Forecasting 2022 inflation: Transitory no more?
German Bund yields had been making higher lows and higher highs since making a low of -.67% on November 4th, 2020, thus creating a channel. If the Bund yield can cross above 0.00%, there is a confluence of resistance at the upper sloping trendline of the channel and the 127.2% Fibonacci extension from the highs of November 1st. 2021 to the lows of December 8th, 2021 near 0.03%. Above there is horizontal resistance from April 2019 at 0.102% and the 161.8% Fibonacci extension from the previously mentioned timeframe near 0.149%. However, notice that the RSI is overbought territory, at 78.71, an indication that yields may be ready for a pullback. Support is at the November 1st highs of -0.064%, the gap-fill from January 5th near -.115% and a confluence of support among the 50-Day Moving Average, the 200-Day Moving Average, and previous highs, between -0.299% and -0.258%.
Trade the Bunds now: Login or Open a new account!
• Open an account in the UK
• Open an account in Australia
• Open an account in Singapore
German Bunds and EUR/JPY have a strong positive correlation. The correlation coefficient for the two assets is +0.91. A reading above +0.80 is considered a strong correlation. Therefore, if German Bund yields continue to move higher, one can expect that EUR/JPY will move higher as well.
2 ways to use correlations to help trade
Just as Bunds bottomed in early December, so did EUR/JPY near 127.47. However, since December 20th, EUR/JPY has had six down days (compared to Bunds two down days). EUR/JPY moved from 127.52 on December 20th, 2021 to 131.60 on January 5th, a gain of over 400 pips in 13 days. The pair stalled at a confluence of resistance, which includes previous lows, the 61.8% Fibonacci retracement from the October 20th, 2021 highs to the December 3rd, 2021 lows, and the 200 day Moving Average between 130.53 and 131.55.
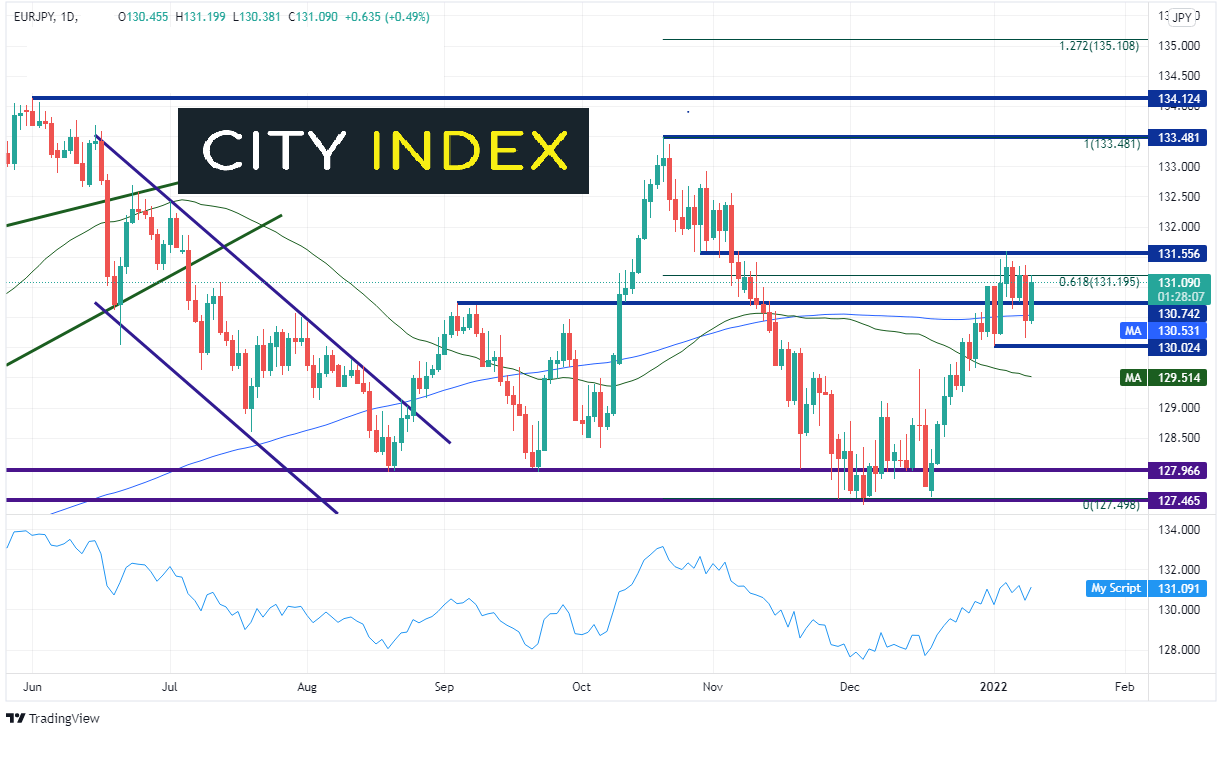
Source: Tradingview, Stone X
Trade EUR/JPY now: Login or Open a new account!
• Open an account in the UK
• Open an account in Australia
• Open an account in Singapore
If price breaks above 131.55, the next level of resistance isn’t until the previous highs at 133.48. Above there is horizontal resistance at 134.12 and the 127.2% Fibonacci retracement from the previously mentioned timeframe at 135.11. Support below the 200 Day Moving Average is at 130.02, then the 50 Day Moving Average at 129.51.
German Bund yields have been on a tear lately and are on their way towards a place they haven’t been in since May 2019, 0.00%! Bund yields are also highly correlated with EUR/JPY. Therefore, if yields can break above the psychological round number resistance of 0.00%, they could bring EUR/JPY along for the ride!
Learn more about forex trading opportunities.
Latest market news
Yesterday 01:32 PM
Yesterday 09:35 AM
Yesterday 07:23 AM
Yesterday 04:48 AM
Yesterday 12:17 AM
July 25, 2024 10:39 PM
Latest Trade Ideas articles

Yesterday 09:35 AM

Yesterday 12:17 AM

July 25, 2024 10:39 PM

July 25, 2024 05:30 PM