

UK banks are set to report Q2 results this week and next on the following dates:
Lloyds on Wednesday, 26th July
Barclays on Thursday, 27th July
NatWest on Friday, 28th July
HSBC on Wednesday, 1st August
What can we learn from US bank's earnings and what to expect from UK banks?
US big banks have already reported and often set the scene with what to expect for banks' results in the UK and Europe. US earnings within the sector were very mixed: Banks more heavily focused on deal-making and investment banking, such as Citigroup and Goldman Sachs, underperformed. Meanwhile, the other major banks benefited from rising net interest margins. While UK banks are less diversified than their US peers and are more retail and commercial-focused, could we see a similar pattern in the UK? It is also worth noting that US banks have risen over the past week on the back of US bank earnings, meaning that some of the optimism could already be priced in.
NIM
The BoE has raised interest rates at the fastest pace in decades as it fights high inflation. After 12 successive rate hikes, the BoE base rate is 5% with another rate hike expected at the start of August.
High interest rates mean that banks can charge more for loans boosting net interest income. However, the amount paid out in deposits should also rises. The FCA warned that UK banks have not passed on rate hikes to savers fast enough. High levels of NII are not likely to be sustainable as competition for deposits starts to play out, and as growth slows in the UK, loan demand could also be expected to slow.
Bad loan provisions
The flip side to rising interest rates is that this pressures borrowers across the economy and increases the likelihood of defaulting on loans. UK insolvencies and bankruptcies rose by 27% in England and Wales last month, highlighting companies' struggles. Meanwhile, mortgage rates have jumped, meaning previously affordable loans are venturing into unaffordability.
Let’s take a closer look:
Barclays
A resilient quarter for fixed-income trading could be overshadowed by rising concerns of a margin squeeze and increasing bad loan impairment charges. Barclays, along with other banks, is under increasing pressure to pass interest rate hikes onto savers, which could impact NIM potentially as soon as this quarter. Management could downgrade the margin outlook for H2, with consensus growth of 12% this year looking vulnerable.
Equities trading is expected to be a weak point, with revenue falling 52%, as well as deal-making. Costs will be under the spotlight, with Q2 anticipated expenses to be £4 billion, while expenses are forecast to drop 3% this year.
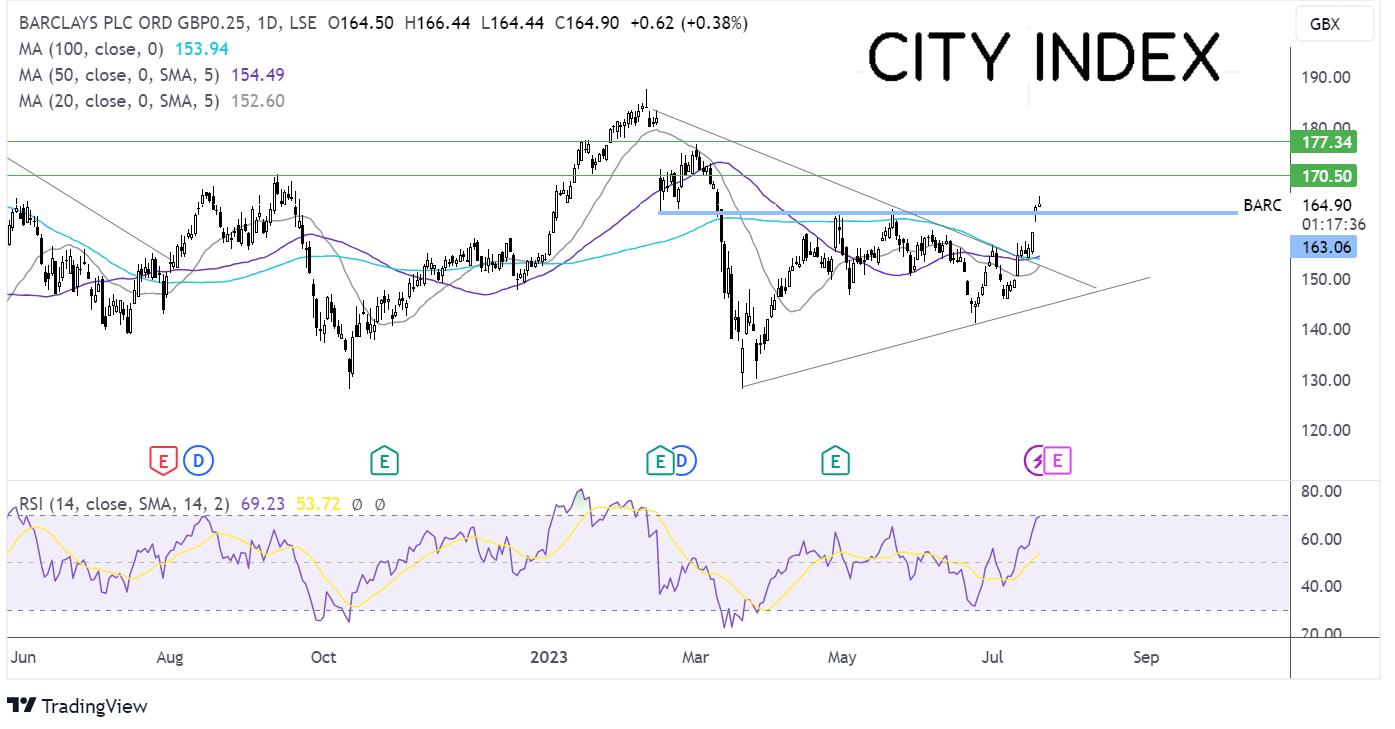
Barclays forecast – technical analysis
Barclays broke out of the symmetrical triangle and rose higher. The price has risen above the resistance around 163p, the April and May high, and the February low, running into resistance at 166p. However, the long upper wick on yesterday’s candle suggests that there was little appetite at the higher price.
Buyers will look to drive towards 170p, the round number ahead of 177p, the March high.
Meanwhile, sellers could look to break below 163p and 159.30p Tuesday’s high. A break below here opens the door to 154p, the confluence of the 50 & 100 sma. A break below here is needed to negate the near-term up trend.
HSBC
Rising interest rates and beneficial currency movements are expected to provide a solid base for Q2 results. However, investors will be watching deposit flows from instant access to higher-paying time deposit accounts, which could prove to be a headwind. Bad loan losses are expected to fall compared to Q1, reflecting an improving picture in China. However, higher rates coupled with the rising chance of a recession in the UK add risk.
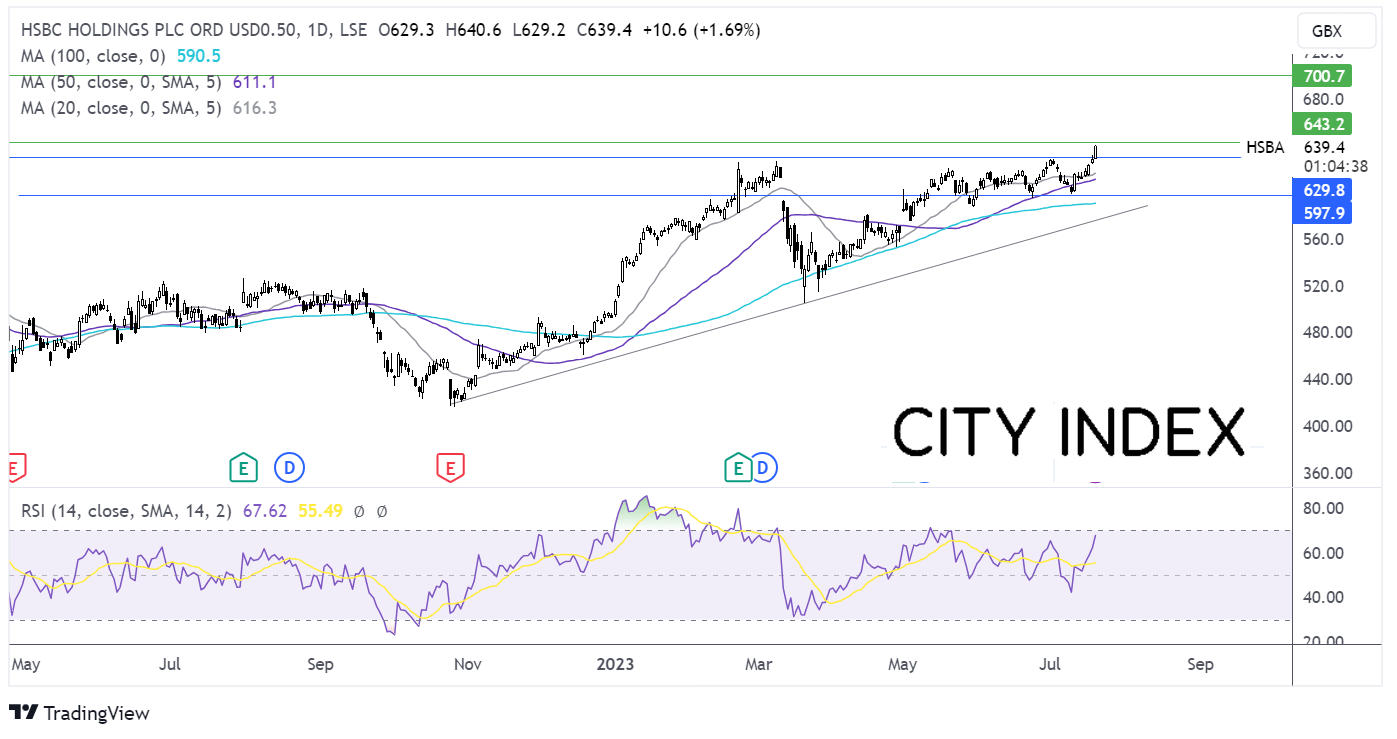
HSBC forecast – technical analysis
HSBC has been trending higher, forming a series of higher highs and higher lows. The prices recently broke above 630p, a key resistance level, and the 2018 high. This, coupled with the RSI above 50 but below 70, keeps buyers hopeful of further gains.
Buyers will look for a rise above 640p to 700p round number. Meanwhile, a break below 630p could open the door to 616p the 20 sma. Sellers need to break below 600p to create a lower low.
NatWest
NatWest NIM will be particularly in focus after Q1 NIM missed estimates by 11 basis points, highlighting the rising competition between banks to attract deposits and rising deposit costs. Deposit repricing will be a key focus amid increasing pressure to accelerate repricing and the higher interest rates on to customers. Given the weak domestic backdrop, bad loan provisions will be in focus after Q1 loan loss provisions were 70% lower than expected.
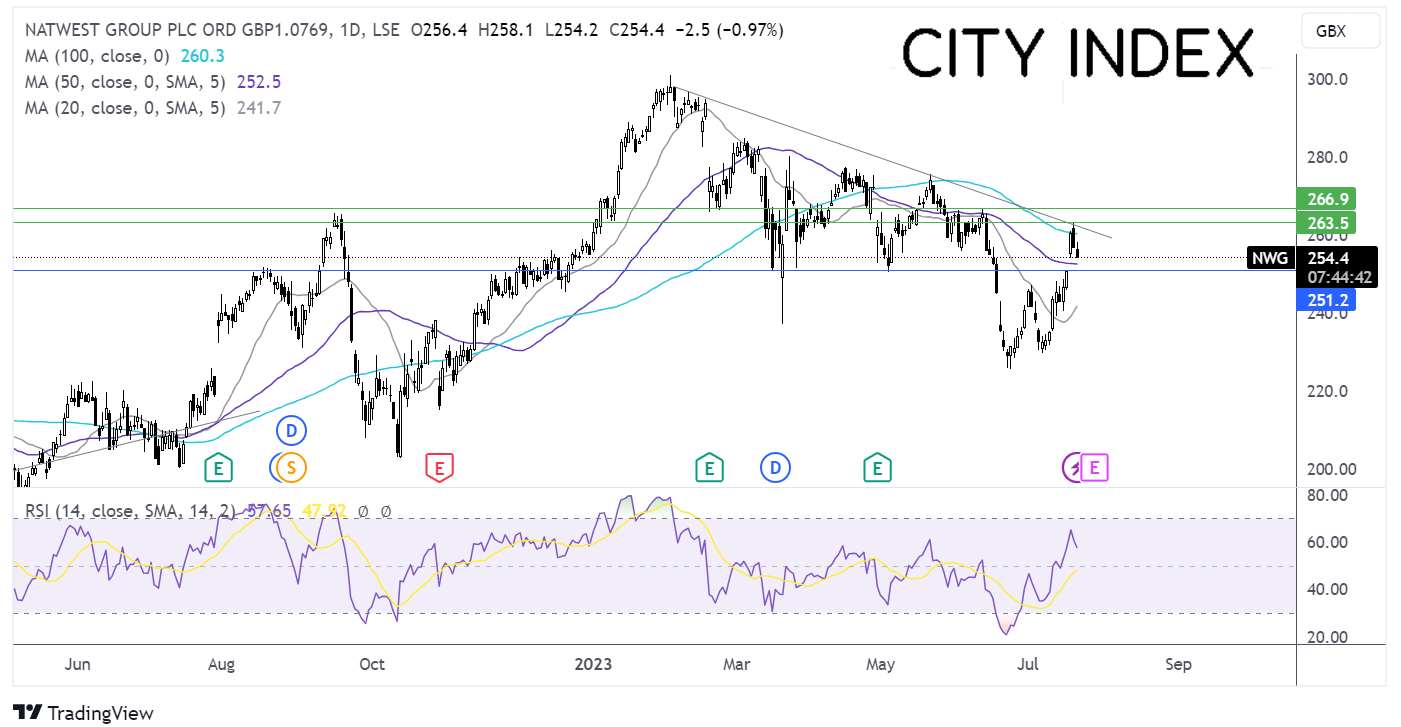
NatWest forecast – technical analysis.
NatWest share price trades below a falling trendline dating back to the start of the year. The price recently rebounded from 225p the 2023 low and tested the falling trendline resistance before falling lower. The price now trades caught between the falling trendline resistance and the 50 sma.
The long upper wick on today’s candle suggests that there was little appetite at the higher prices. Sellers will look for a fall below the 50 sma at 252p to extend losses to 250p, the round number and July 18 high.
Meanwhile, buyers will look to rise above 258p, today’s high, to extend gains to test the falling trendline resistance at 262p.
Lloyds
Lloyds, the UK’s largest mortgage lender, beat Q1 earnings forecasts thanks to strong NII, but signs of stress among some borrowers pointed to tougher times ahead. The market will be watching closely to see how its weakest customers are faring as households deal with the highest inflation in Europe and higher interest rates. Expectations are for NIM to contract in 2Q from Q1 as deposit rates are adjusted higher, and mortgage spreads come under pressure as well.
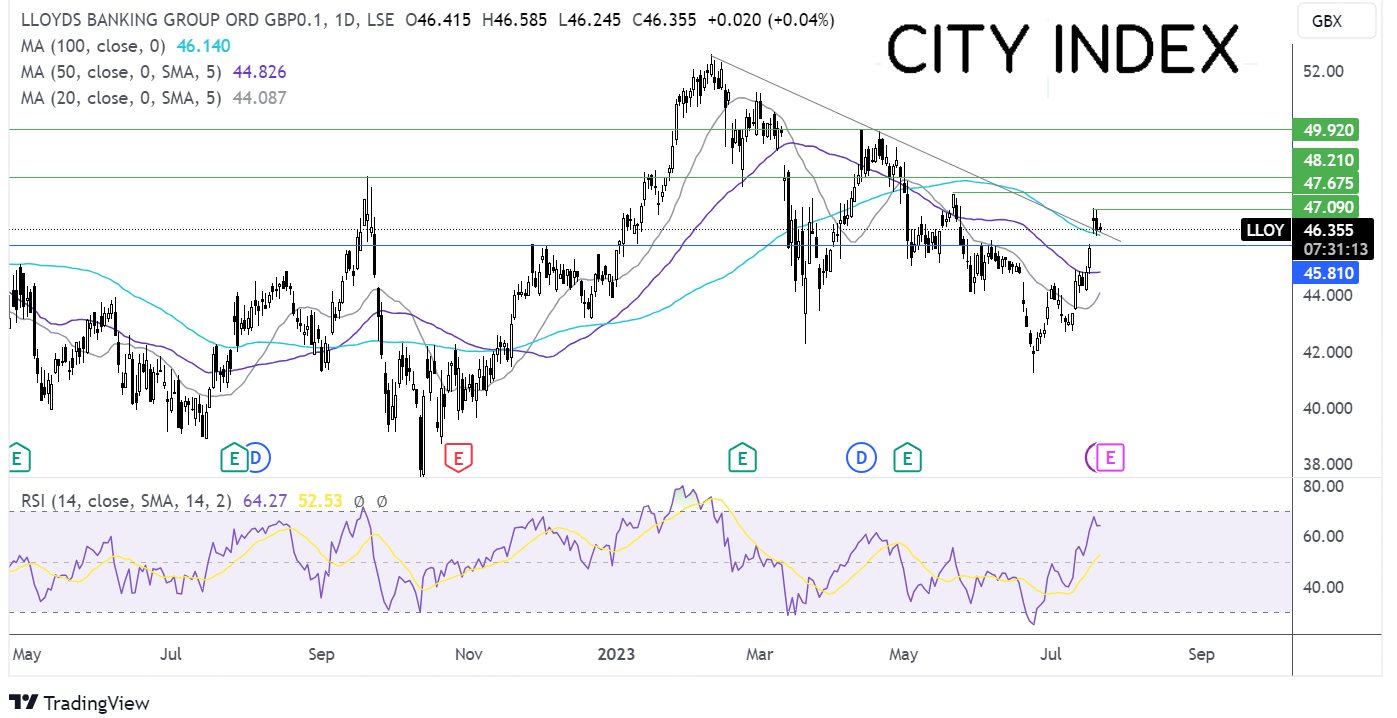
Lloyds forecast – technical analysis
Lloyds gapped above the 100 sma earlier in the week, rising above the multi-month falling trendline, hitting resistance at 47.12 before easing lower.
The long upper wick suggests little appetite for Lloyds shares at the higher price. Sellers will look to break down the falling trendline support and the 100 sma at 46.20 to extend the selloff to 45.80 before exposing the 50 sma at 44.80.
Should buyers successfully defend the falling trendline support, bulls could look to test 47.12, the July high, to bring 47.50, the May high, into focus.
Latest market news
Today 12:16 PM
Today 08:17 AM
Latest Earnings season articles

April 25, 2024 03:09 PM

April 23, 2024 01:15 PM

April 21, 2024 04:00 AM

April 16, 2024 08:00 PM