

Asian Indices:
- Australia's ASX 200 index fell by -20.3 points (-0.27%) and currently trades at 7,510.00
- Japan's Nikkei 225 index has risen by 245.71 points (0.82%) and currently trades at 30,161.85
- Hong Kong's Hang Seng index has risen by 80.55 points (0.31%) and currently trades at 26,434.18
UK and Europe:
- UK's FTSE 100 futures are currently down -24.5 points (-0.34%), the cash market is currently estimated to open at 7,124.87
- Euro STOXX 50 futures are currently down -4.5 points (-0.11%), the cash market is currently estimated to open at 4,220.51
- Germany's DAX futures are currently down -8 points (-0.05%), the cash market is currently estimated to open at 15,835.09
US Futures:
- DJI futures are currently down -269.09 points (-0.76%)
- S&P 500 futures are currently up 11 points (0.07%)
- Nasdaq 100 futures are currently up 4 points (0.09%)
Learn how to trade indices
Japan’s GDP surprises to the upside
Japan’s share markets were the clear outperformers today, thanks to the combined effect of better-than-expected growth data and expectations of more fiscal stimulus. Stronger business spending saw Japan’s GDP was upwardly revised in Q2, rising 0.5% QoQ compared with 0.3% expected. Annualised GDP rose 1.9%, up from 1.3% previously estimated. The TOPIX rallied throughout the day and is currently up 0.67%, the Nikkei 225 is up 0.8% and formed a bullish engulfing day despite its bearish hammer yesterday.
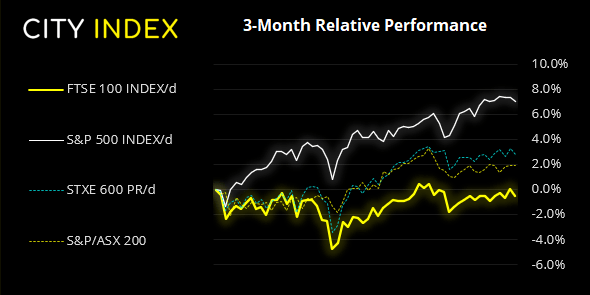
The FTSE 100 traded lower with its European counterparts yesterday as concerns over global growth weighed on sentiment. We have been sceptical of its rally towards 7200 and yesterday’s sell-off (which failed to test it once more) sends another red flag. Closing the day with a dark cloud cover pattern, a break beneath 7138 confirm the bearish 2-bar reversal pattern.
FTSE 350: Market Internals
FTSE 350: 4137.32 (-0.53%) 07 September 2021
- 85 (24.22%) stocks advanced and 248 (70.66%) declined
- 35 stocks rose to a new 52-week high, 4 fell to new lows
- 75.5% of stocks closed above their 200-day average
- 72.93% of stocks closed above their 50-day average
- 23.08% of stocks closed above their 20-day average
Outperformers:
- + 3.3% - Marks and Spencer Group PLC (MKS.L)
- + 2.8% - DS Smith PLC (SMDS.L)
- + 2.6% - AO World PLC (AO.L)
Underperformers:
- -12.1% - Meggitt PLC (MGGT.L)
- -10.7% - TP ICAP Group PLC (TCAPI.L)
- -5.25% - IntegraFin Holdings plc (IHP.L)
Forex:
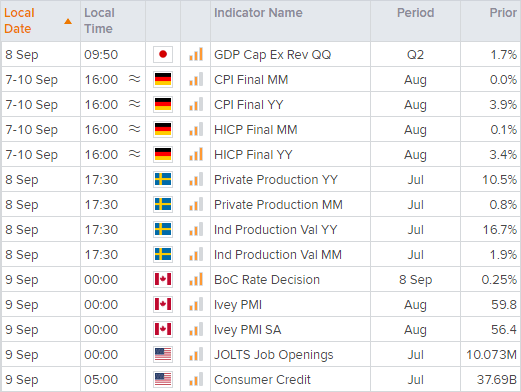
Final CPI data for Germany is released at 06:00. Should we see inflation upgraded then it could provide a tailwind for the euro ahead of tomorrow’s ECB meeting.
Today’s main calendar event is the BOC meeting. No change of rate is expected, and the point of interest hinges upon whether they will delay tapering the bond purchase until the next meeting, or go ahead as planned. Should they taper then it could support the CAD slightly and relieve some selling pressure. As would a strong IVEY PMI print which is released at the same time of 12:00 AEST.
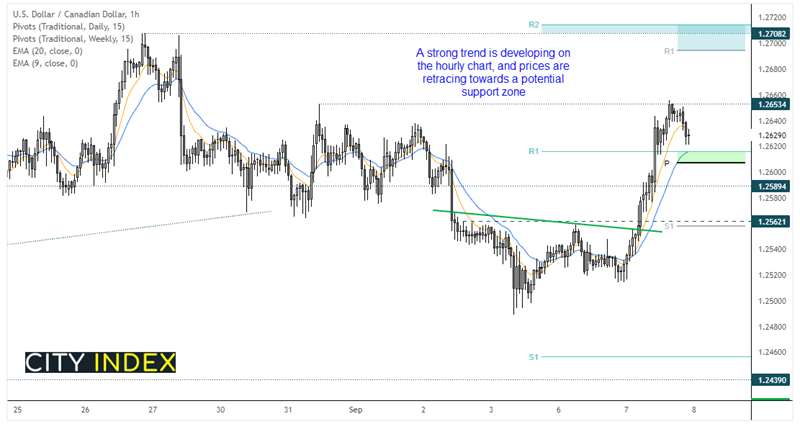
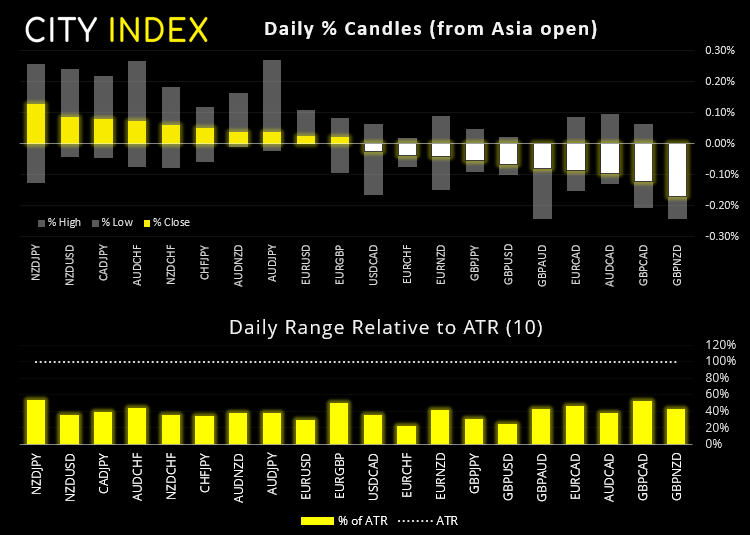
We see further upside potential for the US dollar this week, and if BOC do indeed taper it could helped send USD/CAD to new highs (which was yesterday’s strongest pair). The hourly chart is developing a strong bullish trend although prices have eased back from the highs. Yet we note a decent support zone above 1.2600 which comprises of the daily pivot point, weekly R1 and 0-bar eMA. Should these levels provide support and, ideally, bullish reversal patterns then we’ll be on guard for a break above 1.2653 and for a run closer to the resistance zone around 1.2700.
Learn how to trade forex
Commodities:
The US dollar’s rebound has put the commodities breakout on ice. We were waiting for the CRB index to break above 221.25 but it now shows the potential to continue retracing lower until the US dollar index rally fades. A break beneath 216.4 assumes a deeper correction counter to its dominant trend.
WTI is back below its 50-day eMA and trades around the midway point between 67.12 – 70.0. And this is not too bad considering the dollar’s strength yesterday. Patience may be required but it’s remains plausible to consider prices breaking (and holding) above 70.0. Although that comes into doubt if we finally see bearish momentum return on the daily chart, which would then mark 70.63 as the top.
Up Next (Times in BST)
You can view all the scheduled events for today using our economic calendar, and keep up to date with the latest market news and analysis here.
How to trade with City Index
Follow these easy steps to start trading with City Index today:
- Open a City Index account, or log-in if you’re already a customer.
- Search for the market you want to trade in our award-winning platform.
- Choose your position and size, and your stop and limit levels.
- Place the trade.
Latest market news
Yesterday 01:32 PM
Yesterday 09:35 AM
Yesterday 07:23 AM
Yesterday 04:48 AM
Yesterday 12:17 AM
July 25, 2024 10:39 PM
Latest FTSE 100 articles

July 10, 2024 11:55 PM

July 4, 2024 11:00 AM

June 19, 2024 12:00 PM
March 11, 2024 04:30 PM