

Asian Indices:
- Australia's ASX 200 index rose by 2.6 points (0.04%) and currently trades at 7,420.00
- Japan's Nikkei 225 index has fallen by -456.23 points (-1.64%) and currently trades at 27,325.53
- Hong Kong's Hang Seng index has fallen by -553.3 points (-2.1%) and currently trades at 25,762.02
UK and Europe:
- UK's FTSE 100 futures are currently down -36.5 points (-0.52%), the cash market is currently estimated to open at 7,041.92
- Euro STOXX 50 futures are currently down -30.5 points (-0.74%), the cash market is currently estimated to open at 4,086.27
- Germany's DAX futures are currently down -103 points (-0.66%), the cash market is currently estimated to open at 15,537.47
US Futures:
- DJI futures are currently up 153.6 points (0.44%)
- S&P 500 futures are currently down -192.25 points (-1.28%)
- Nasdaq 100 futures are currently down -32.5 points (-0.74%)
Learn how to trade indices
Asian shares on track for worst month in 16
After a two-day hiatus, bears stepped back into China’s markets despite verbal (and actual) intervention earlier this week to stabilise markets. The long-term ramifications from Beijing’s crackdown on the tech and education sectors are yet to be fully absorbed, so it should be remembered that volatility cuts both ways.
As it stands, Asian equities have suffered their worst session in 16-months with the MSCI’s APAC (ex-Japan) index down -5.6% in July. The Hang Seng and HSCE indices are currently down -1.9% and -2.8% respectively, the Nikkei 225 fell -1.8% and the CSI300 currently trades around -1% lower.
US and European futures have opened lower so we get to find out today if contagion sets in once more. If so, we’d expect safe havens such as JPY, CHF and bonds perform well. As for gold, it may depend on whether investors need to cover margin calls by closing gold positions as to whether it receives a risk-off bid.
FTSE 350: Market Internals
FTSE 350: 4070.79 (0.88%) 29 July 2021
- 205 (58.40%) stocks advanced and 132 (37.61%) declined
- 29 stocks rose to a new 52-week high, 0 fell to new lows
- 78.35% of stocks closed above their 200-day average
- 58.12% of stocks closed above their 50-day average
- 6.55% of stocks closed above their 20-day average
Outperformers:
- + 7.20% - Morgan Advanced Materials PLC (MGAMM.L)
- + 6.88% - Indivior PLC (INDV.L)
- + 6.75% - Rentokil Initial PLC (RTO.L)
Underperformers:
- -6.55% - BT Group PLC (BT.L)
- -6.33% - Smith & Nephew PLC (SN.L)
- -5.96% - Weir Group PLC (WEIR.L)
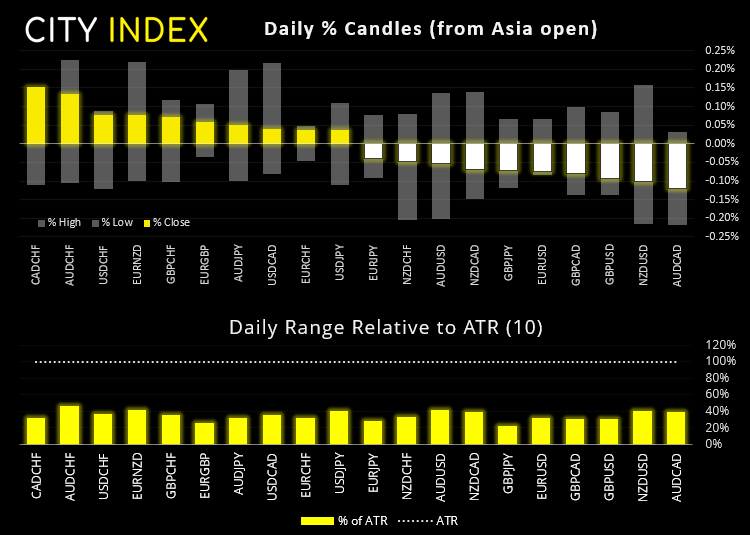
Forex pairs – asleep behind the wheel?:
Ranges were effectively flat as a pancake overnight for currency pairs. But with several data points in the pipeline then we’re hopeful markets will awake from their lull.
Growth data is in focus again with the release of Q2 preliminary GDP reports for Germany and Europe. Unlike the US which has pumped out growth for three consecutive quarters, German GDP contracted in Q1 after barely expanding in Q4 2020. However, it is expected to expand at a rate of 2% QoQ and 9.6% YoY, whilst eurozone growth is forecast to rise 1.5% QoQ and 2% YoY. Yet with the ECB hell bent on remaining dovish, and CPI expected to slip to 0.8% from 0.9% then it’s hard to image how far growth would need to exceed expectations for the central bank to even raise an eyebrow.
GBP/AUD has been on a great run of late, yet the two bearish hammers on the daily chart have found resistance at the monthly R3 pivot, so we suspect a corrective pullback could be on the cards.
The bullish rally on the GBP/USD hourly chart remains firmly within its rising channel, although prices are retracing within a bull-flag pattern. Should prices continue to move lower our bias remains bullish above 1.3920, where the 50-bar eMA and weekly R2 pivots reside and our target at 1.40 remains in place.
At the start of the US session consumption data is released at 13:30 BST and Michigan consumer sentiment at 14:00. Also keep an eye on Canada’s monthly GDP report which could further weigh on USD/CAD if it comes in above the -0.3% expected.
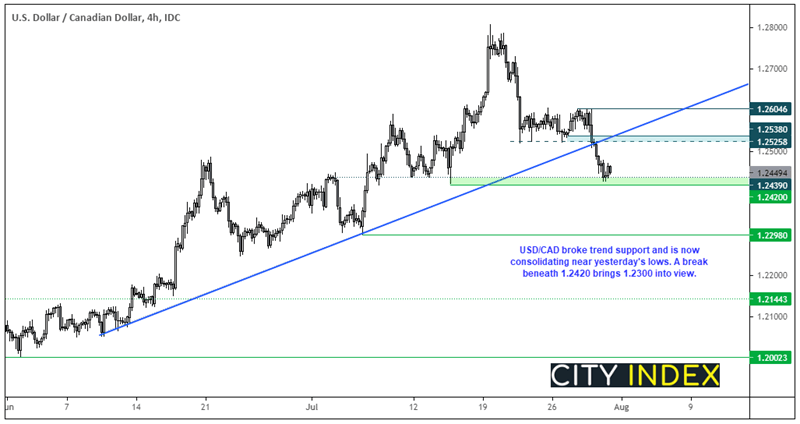
We can see on the four-hour chart that USD/CAD broke trend support after printing a prominent swing high around 1.2600. Support has been found near the 1.2420 low and prices are now consolidating. Given the depth of yesterday’s sell-off then a bounce from current levels would not come as a surprise but, beyond that, we’d then look for evidence of a lower high to form as part of it next leg lower. Our bias remains bearish below 1.2525 / broken trendline, whichever prompts price action weakness first.
Learn how to trade forex
Commodities:
Copper futures continue to try and build a level of support above the 4.435 support level and yesterday’s bullish inside bar provides a glimmer of hope that a swing low has already been seen.
WTI is trading just below $74 and should the dollar weakness persist then there’s a decent chance that oil can break above that level today. We remain bullish above $70.
Up Next (Times in BST)
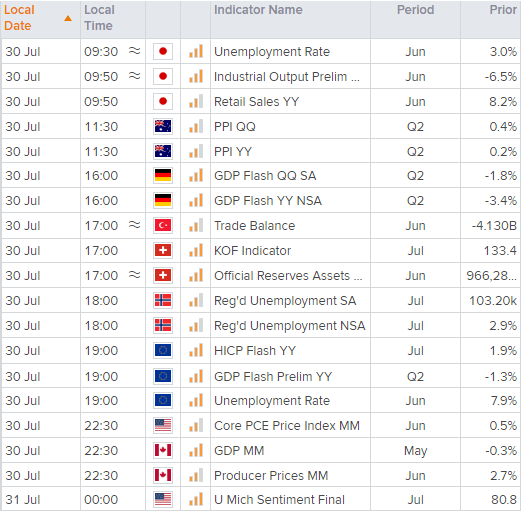
You can view all the scheduled events for today using our economic calendar, and keep up to date with the latest market news and analysis here.
How to trade with City Index
Follow these easy steps to start trading with City Index today:
- Open a City Index account, or log-in if you’re already a customer.
- Search for the market you want to trade in our award-winning platform.
- Choose your position and size, and your stop and limit levels.
- Place the trade.
Latest market news
Yesterday 01:32 PM
Yesterday 09:35 AM
Yesterday 07:23 AM
Yesterday 04:48 AM
Yesterday 12:17 AM
July 25, 2024 10:39 PM
Latest FTSE 100 articles

July 10, 2024 11:55 PM

July 4, 2024 11:00 AM

June 19, 2024 12:00 PM
March 11, 2024 04:30 PM