
US Dollar, EUR/USD Talking Points:
- It was a rough Q4 for the US Dollar with DXY down as much as -6.27% from the highs.
- EUR/USD strength was a large driver of that move and bulls are holding on to a bullish trend ahead of tomorrow’s NFP report. The big question now is whether they can substantiate continuation above the 1.1000 handle.
- I’ll be discussing these themes in-depth in the weekly webinar on Tuesday. It’s free for all to register: Click here to register.
It’s rare that a monthly chart can be appropriate but the first week of the year is certainly an exception. It can help to provide perspective from the most recently completed year while also garnering an idea for how the themes that have impacted the market may continue to do so in the year ahead. Or, at the least, it allows for some context that can be valuable as the New Year plays out.
As a case in point, EUR/USD came into 2023 with a full head of steam after bottoming in September of 2022. That strength largely continued, albeit to a lesser degree, through the first half of last year; but bulls continually stumbled above the 1.1000 level and that restrained any big-picture trends from taking hold. The USD rally that showed up in July was intense, and lasted for a couple of months, but EUR/USD bears were unable to break much fresh ground and on net, last year shows EUR/USD price action remaining within an approximate 600-pip box for much of the time.
There are some notable levels that can be drawn from this, and on the below chart I’ve added a Fibonacci retracement around the 2021-2022 major move. The 61.8% marker of that study marked the 2023 high at 1.1275 and that remains a level of interest into this year, particularly if bulls muster the motivation to evoke another test of the highs. But there’s also a zone inside of that price, running from approximately 1.1070 up to 1.1120 that showed a tendency to hold resistance multiple times last year. And on the other side of the matter, support around 1.0500 was tested multiple times but bears were simply unable to make much headway below that level.
EUR/USD Monthly Price Chart
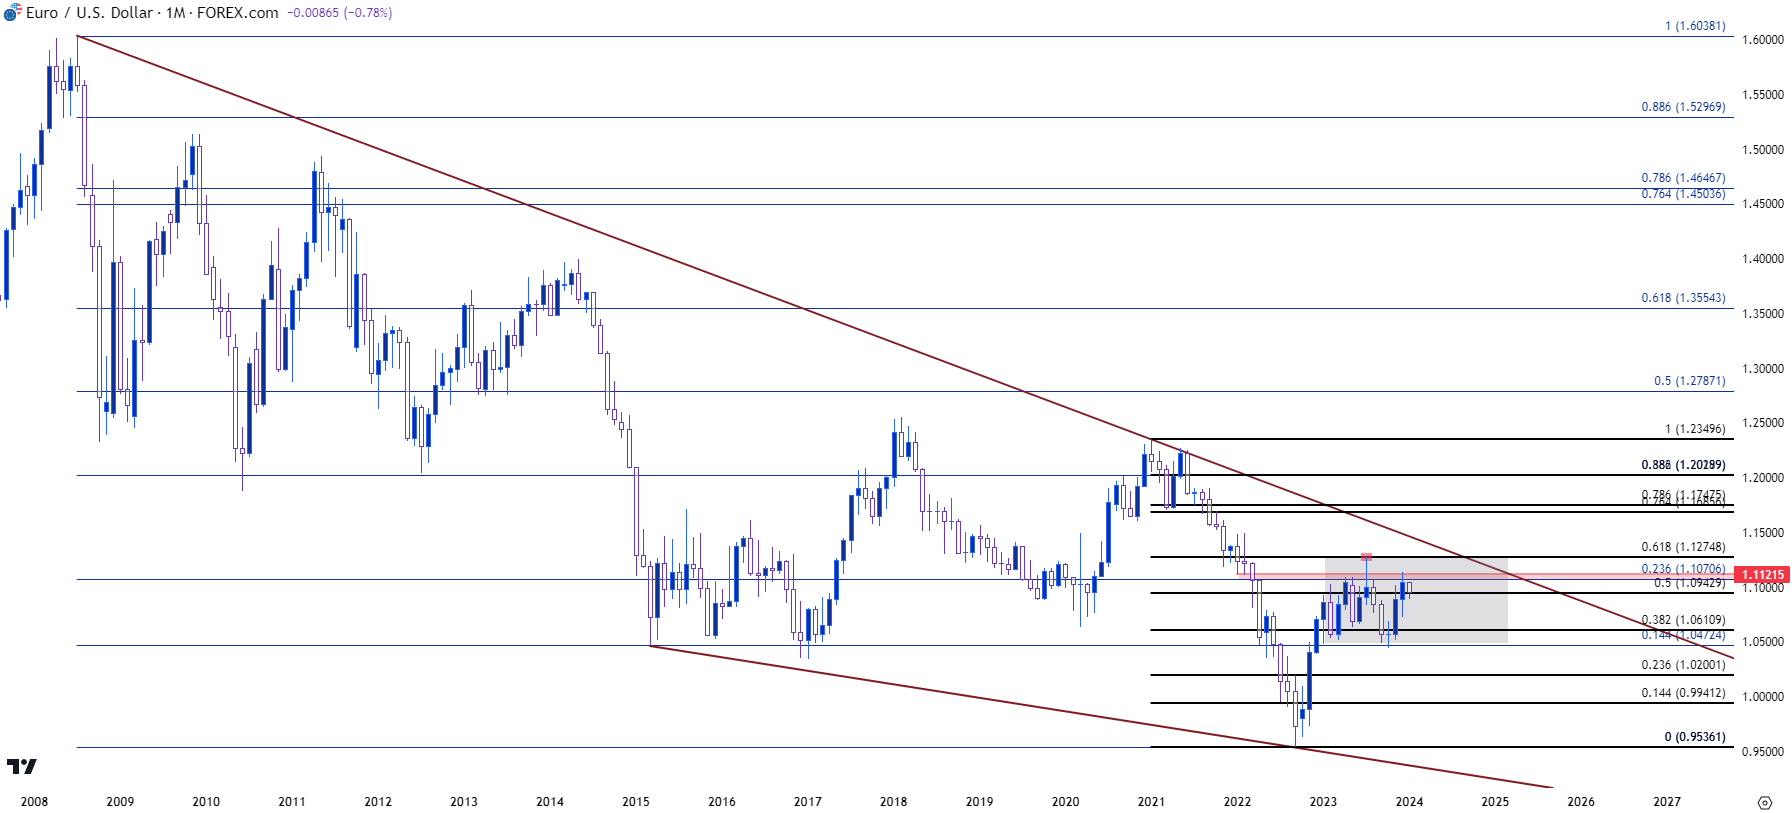 Chart prepared by James Stanley, EUR/USD on Tradingview
EUR/USD Weekly
While the monthly chart prominently displays the box that built through 2023, the weekly chart highlights a few trends that appeared throughout the year as driven by larger macro themes and there’s even a tie into rates which took on particular importance during last quarter.
Like Q4 of 2022, hints of change began to show around the open of Q4 in 2023; and there was even a tie to the CPI reports released in November of each year. I had highlighted that ahead of the release and price action showed a similar pattern after inflation showed a larger-than-expected drop, helping to remove expectations for any additional hikes and instead beginning to gear markets up for rate cuts from the Fed at some point in 2024.
‘When’ remains the operative question but at this point markets are expecting up to six hikes this year from the FOMC, even as inflation remains above 3%. This is a stark contrast to the macro theme that was driving into Q4 as worry was populating around the Eurozone, to the degree that EUR/USD posted 11 consecutive weekly losses – an all-time-record since the Euro came into conception in 1999.
But a key point of differentiation was on display at rate meetings in December, when FOMC Chair Jerome Powell noted that the bank had already begun discussing rate cuts. And that stands in stark contrast to a European Central Bank of which Christine Lagarde remarked that the conversation on that topic hadn’t yet started. That helped to further push the bullish trend that started earlier in the quarter, pushing price back up to range resistance.
EUR/USD Weekly Chart
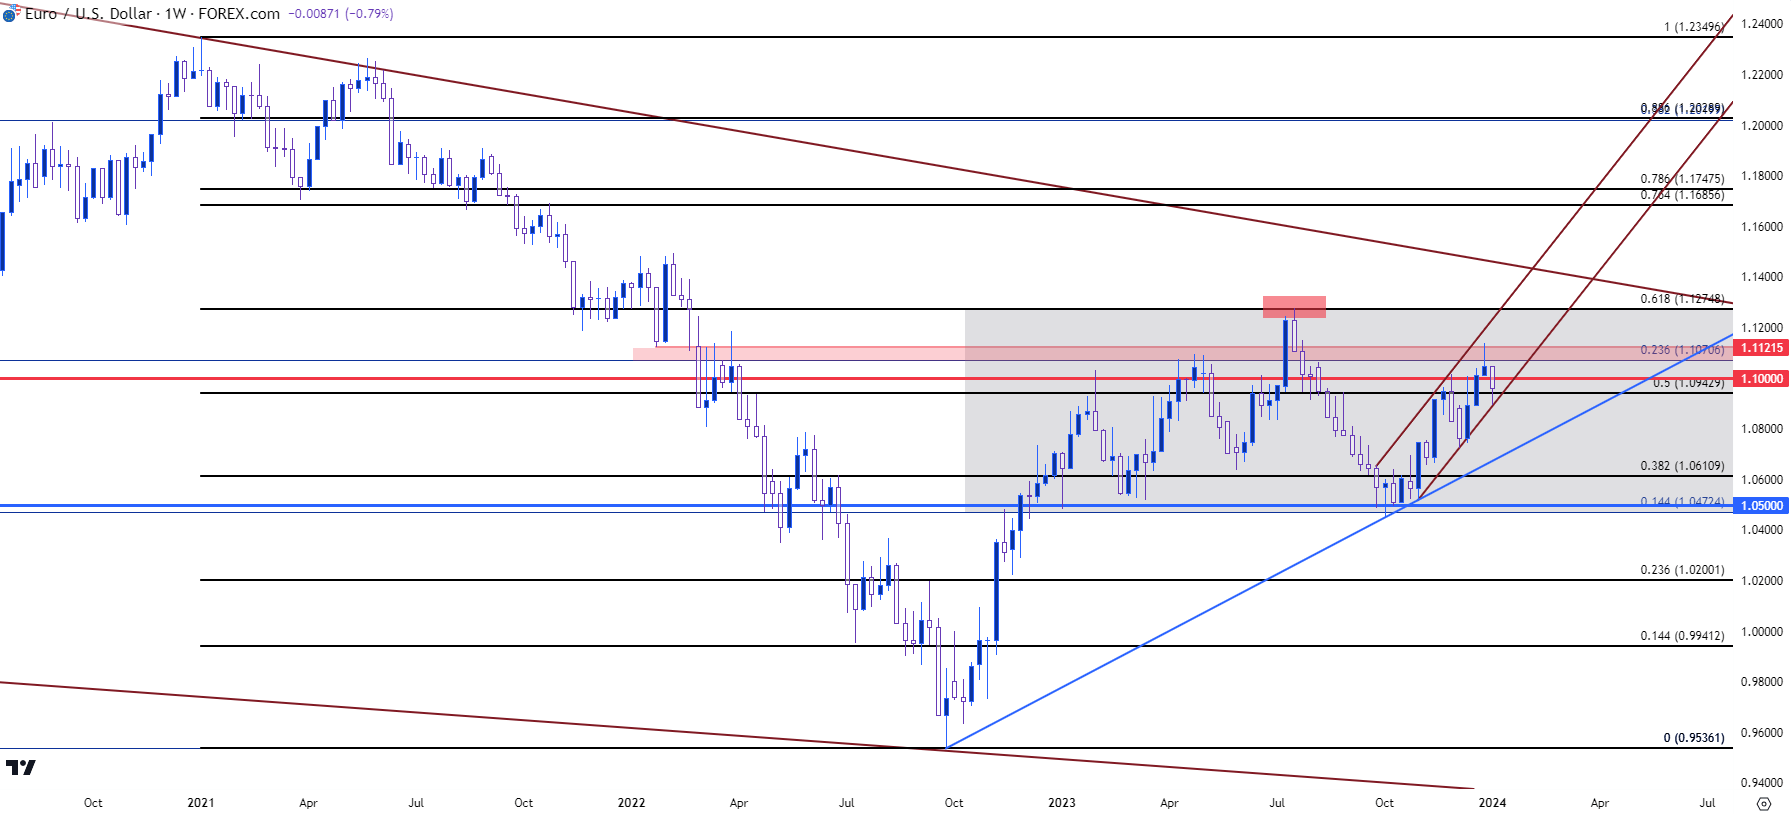 Chart prepared by James Stanley, EUR/USD on Tradingview

EUR/USD Daily
While last year was mostly range-bound as noted from the above two charts, there were multiple trends to work with from the daily and for shorter-term traders this allows for opportunity. Price is still holding within the bullish trend that started in Q4 and EUR/USD is holding near range resistance. The US Dollar has put in a notable push of strength to start the New Year, and there’s a major driver on the calendar for tomorrow with Non-farm Payrolls.
This is prime opportunity for bulls to show their hand; and if they don’t, well, the range in EUR/USD may continue for a while longer.
As for possible support, the 200-day moving average is currently confluent with the support trendline of the channel that’s been in-play over the past few months. That plots around 1.0845 and if sellers can evoke a push below that, there will be larger signs of possible change in the market regarding that prior bullish trend. Below that, there’s a major decision point around the psychological level of 1.0750, which showed resistance-turned-support a month ago.
For resistance, the 1.1000 level still looms large and if sellers show up there to cap any advances, there could be lower-high potential to open the door for deeper pullback potential.
EUR/USD Daily Price Chart
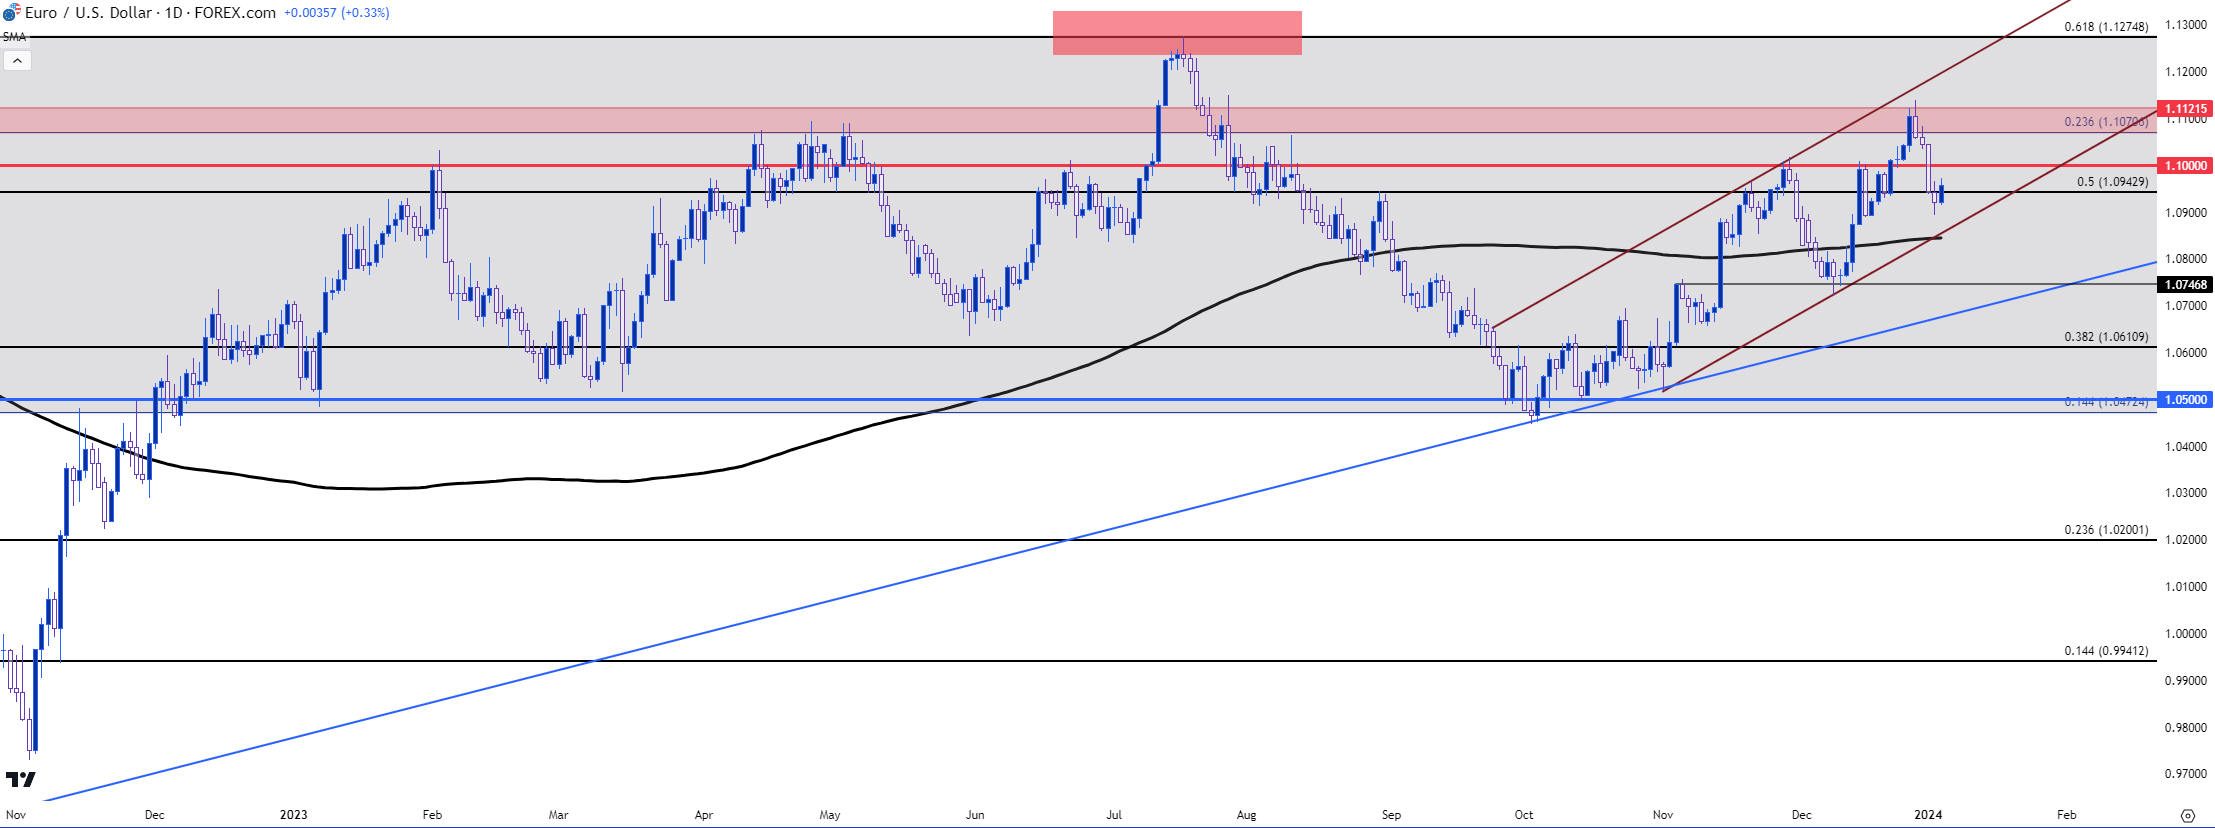 Chart prepared by James Stanley, EUR/USD on Tradingview
--- written by James Stanley, Senior Strategist
Latest market news
Yesterday 01:32 PM
Yesterday 09:35 AM
Yesterday 07:23 AM
Yesterday 04:48 AM
Yesterday 12:17 AM
July 25, 2024 10:39 PM
Latest Trade Ideas articles

Yesterday 09:35 AM

Yesterday 12:17 AM

July 25, 2024 10:39 PM

July 25, 2024 05:30 PM