March 8, 2022 8:56 PM

The Euro has been moving lower against many currencies lately. For example, EUR/USD has moved from 1.1498 down to 1.0806 over the last month! And one can see as to why:
- The Euro zone is a neighbor to a current war zone country, Ukraine.
- Though inflation has been increasing over last year, the ECB remains dovish (for the moment). The central bank continues to purchase bonds and will continue to do so for at least the next 6 months.Note that the ECB meets on Thursday and it could decide to increase the pace of bond tapering.
Meanwhile, the Australia Dollar and the New Zealand Dollar have been on the rise. With many commodities such as oil, gold, and wheat soaring, commodity currencies have gone along for the ride. For example, since January 28th, AUD/USD has moved from 0.6968 up to 0.7441 while NZD/USD has moved from 0.6529 up to 0.6926. Therefore, it would make sense for EUR/AUD and EUR/NZD to move lower.
Trade EUR/AUD now: Login or Open a new account!
• Open an account in the UK
• Open an account in Australia
• Open an account in Singapore
EUR/AUD has been moving aggressively lower since February 4th, when the pair made a high of 1.6225. Yesterday, the pair bottomed at 1.4563, a move of 1,662 pips in just over a month! However, yesterday’s candlestick formation was a hammer, in which price opens and moves lower early in the session. Later, buyers enter the market and bring price back up to close near the open for the day. A hammer is a one candle reversal formation. With today’s price action moving higher, some may consider this a morning star formation, which is a 3-candlestick reversal pattern. Price moves lower the first day, makes a hammer formation the second day, and closes higher (near the first day open) on the last day. The 3-candlestick formation is a stronger signal than the hammer by itself.
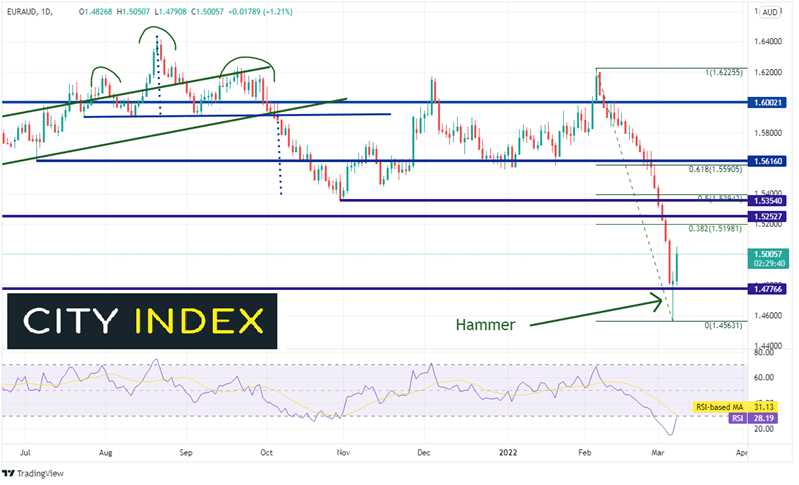
Source: Tradingview, Stone X
How to trade the morning star pattern
Notice that the RSI is still in oversold conditions despite the move higher. If the RSI reaches 30, it will provide more support for a pause or reversal of the downtrend. First support is at yesterday’s low of 1.4463 then horizontal support at the July 2017 lows near 1.4407. The first resistance is at the 38.2% Fibonacci retracement from the highs of February 4th to yesterday’s lows, near 1.5198. If price breaks above there, horizontal resistance sits at 1.5253 and 1.5354.
The price action for EUR/NZD has been similar to that of EUR/AUD. On February 4th, the pair made a high of 1.7359. Yesterday, the pair bottomed at 1.5642, a move of 1,717 pips in just over a month! Yesterday’s price action formed a hammer on the daily timeframe. However, this price action would not be considered a morning star formation because EUR/NZD didn’t retrace nearly as much of the first day of the potential pattern as EUR/AUD.
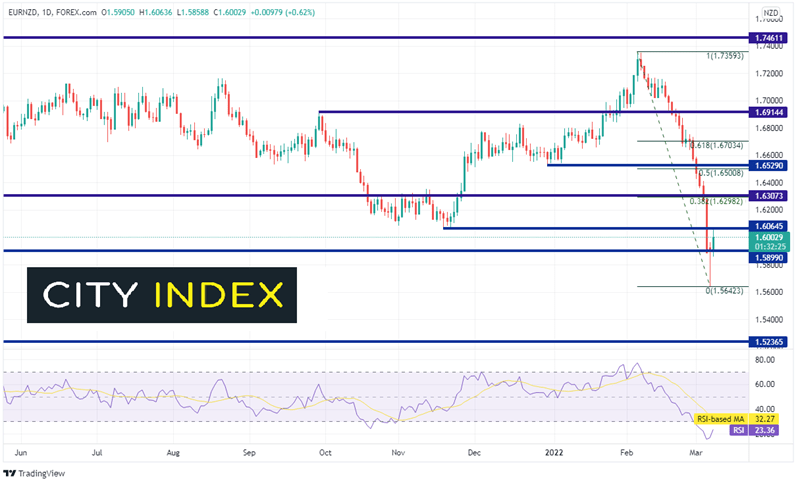
Source: Tradingview, Stone X
Trade EUR/NZD now: Login or Open a new account!
• Open an account in the UK
• Open an account in Australia
• Open an account in Singapore
Notice that the RSI for EUR/NZD is still in oversold conditions despite the move higher, just as with the RSI for EUR/AUD. If the RSI reaches 30, it will provide more support for a pause or reversal of the downtrend. First support is at yesterday’s low of 1.5642, then the July 2017 lows near 1.5237! Horizontal resistance is at today’s high of 1.6064. Above there is horizontal resistance and the 38.2% Fibonacci retracement from the February 4th highs to yesterday’s lows, near 1.6300. The third resistance is at the 50% retracement from the same timeframe at 1.6500.
Learn more about forex trading opportunities.
Latest market news
Yesterday 01:32 PM
Yesterday 09:35 AM
Yesterday 07:23 AM
Yesterday 04:48 AM
Yesterday 12:17 AM
July 25, 2024 10:39 PM
Latest Trade Ideas articles

Yesterday 09:35 AM

Yesterday 12:17 AM

July 25, 2024 10:39 PM

July 25, 2024 05:30 PM