June 28, 2021 5:17 PM
DXY isn’t a currency pair, but USD/CHF is!
The US Dollar Index (DXY) is made up of a basket of currencies, which currently include the EUR (57.6%), JPY (11.6%), GBP (11.9%), CAD (9.1%), SEK (4.2%) and CHF (3.6%). Although the index is only comprised of 6 currencies the index is used to give global look at the value of the US Dollar.
See here to learn everything you wanted to know about the DXY.
On a daily timeframe, the US Dollar Index (DXY) chart has been moving higher out of a descending wedge, which began on April 1st near 93.47, since May 25th. However, it wasn’t until June 16th that the pair began to move aggressively higher as FOMC guidance was a bit more hawkish than expected. The target for the breakout of the bearish wedge is a 100% retracement of the wedge. Notice that on the move higher, the DXY stalled at the 61.8% retracement from those April 1st highs to the May 25th lows, just above 92.00. The index pulled back in a pennant formation and has recently broke out higher above the pennant. The target for the pennant is the length of the pennant “pole” added to the breakout point. In this case, the target is near 93.35, just pips away from the target of the wedge, which is 93.43!
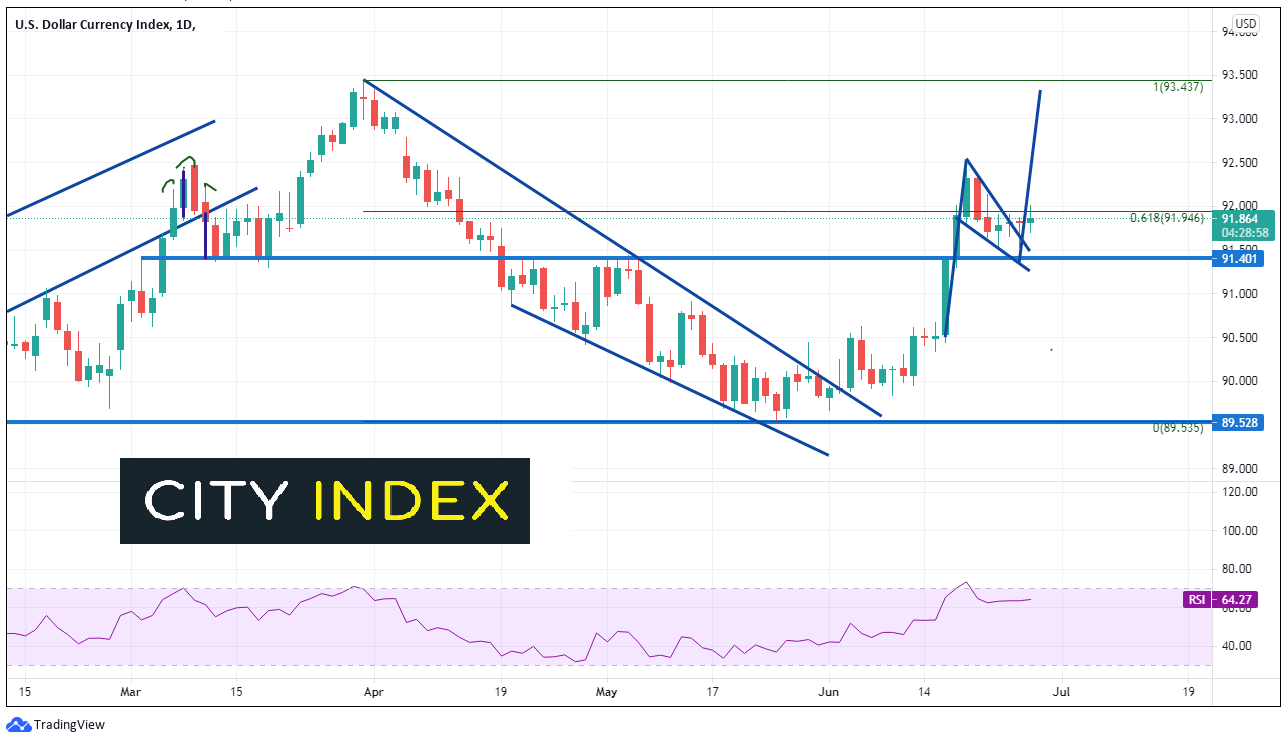
Source: Tradingview, City Index
USD explained: A guide to the US dollar
The correlation coefficient gives the relationship between 2 assets. The range of values for the correlation coefficient is from -1.00 to +1.00. A reading of +1.00 means that the 2 assets are perfectly positively correlated, or in other words, they move in the same direction 100% of the time. A reading of -1.00 means that the 2 assets are perfectly negatively correlated, or in other words, they move in opposite directions 100% of the time. A reading of 0.00 means that there is no correlation between the assets whatsoever. Traders should be looking correlation coefficients between 2 assets that are above +0.80 or below -0.80. A reading of +0.80 indicates there is a strong positive correlation between 2 assets. A reading of -0.80 indicates there is a strong negative correlation between 2 assets.
The bottom of the chart below shows the current correlation coefficient between DXY and USD/CHF. The reading is +0.98! Some traders may not have access to trade DXY. It may be because it’s not offered, or it may be because of government regulations. Therefore, regardless of the reason, given the correlation coefficient between DXY and USD/CHF, USD/CHF may be a good substitute for those looking to trade DXY.
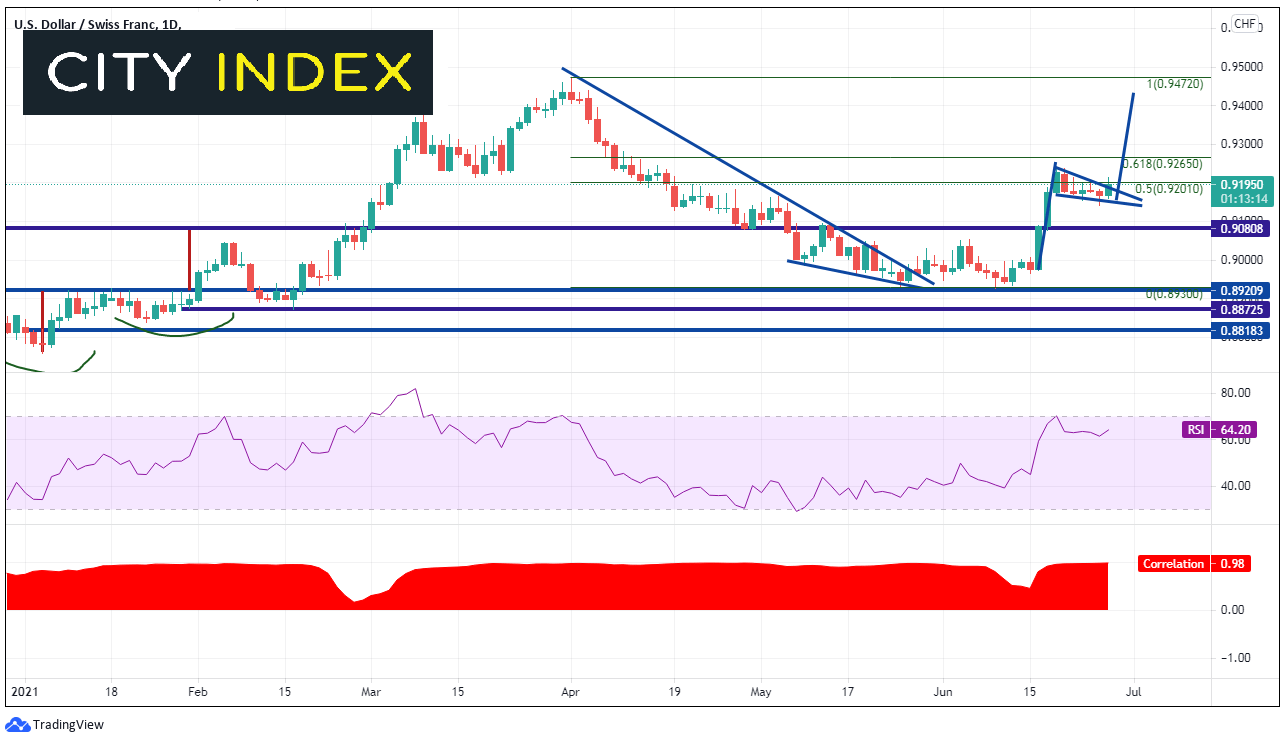
Source: Tradingview, City Index
Notice on the daily chart of USD/CHF that the pair had formed a descending wedge off the highs from April 1st. USD/CHF began trading out of the wedge on May 27th, however it wasn’t until June 16th that the pair began trading aggressively higher. On the move higher, USD/CHF stopped just short of the 61.8% Fibonacci retracement level from the April 1st highs to the May 27th lows., near 0.9250. The pair pulled back in a pennant formation and has recently broke higher above the pennant. The target for the pennant is near 0.9432, near the target for the wedge, which is 0.9472.
If traders would like to trade DXY, but don’t have the means to do so, USD/CHF may be a good substitute. There is almost a perfect positive correlation between the 2 assets. Keep in mind that at times the correlation coefficient may be under +0.80, such as June 9th to June 16th. However, the correlation between DXY and USD/CHF was still positive. This means that the 2 assets still trade in the same direction, the correlation just isn’t as strong.
Log in or open an account now to trade USD/CHF!
Latest market news
Yesterday 01:32 PM
Yesterday 09:35 AM
Yesterday 07:23 AM
Yesterday 04:48 AM
Yesterday 12:17 AM
July 25, 2024 10:39 PM
Latest DXY articles

July 22, 2024 09:30 AM

July 17, 2024 11:18 PM

July 15, 2024 11:20 PM

July 12, 2024 10:38 AM