

Crude Oil, USD/CAD Key Points
- Oil prices have rallied this week on concerns over supply disruption in the Red Sea.
- WTI is showing early signs of reversing off bearish trend line resistance.
- USD/CAD is oversold at 4-month lows, but the bearish trend remains intact.
WTI Crude Oil Analysis
Just when all hope appeared lost for bulls, the crude oil market has staged an impressive comeback.
From a fundamental, geopolitical view, the recent Houthi attacks on ships in the Red Sea has heightened concerns about potential oil supply disruptions in the region; headlines that drilling giant British Petroleum (BP) would temporarily halt transits through the Red Sea exacerbated these fears. Now, the US and its allies are reportedly considering military strikes against the rebels, suggesting that the previously announced regional task force may not be enough to secure the key region.
Partially allaying those concerns this afternoon, the EIA reported that weekly oil inventories report by 2.9M barrels, a massive shift from the 2.3M drawdown economists had expected. This figure comes on the back of news that US production hit a record high of 1.3M bpd last week. While the global supply picture remains murky, the continued growth of US production remains a long-term secular trend, but the potential for disruptions in the Middle East is a short-term risk that is driving prices higher for now.
Crude Oil Technical Analysis – WTI Daily Chart
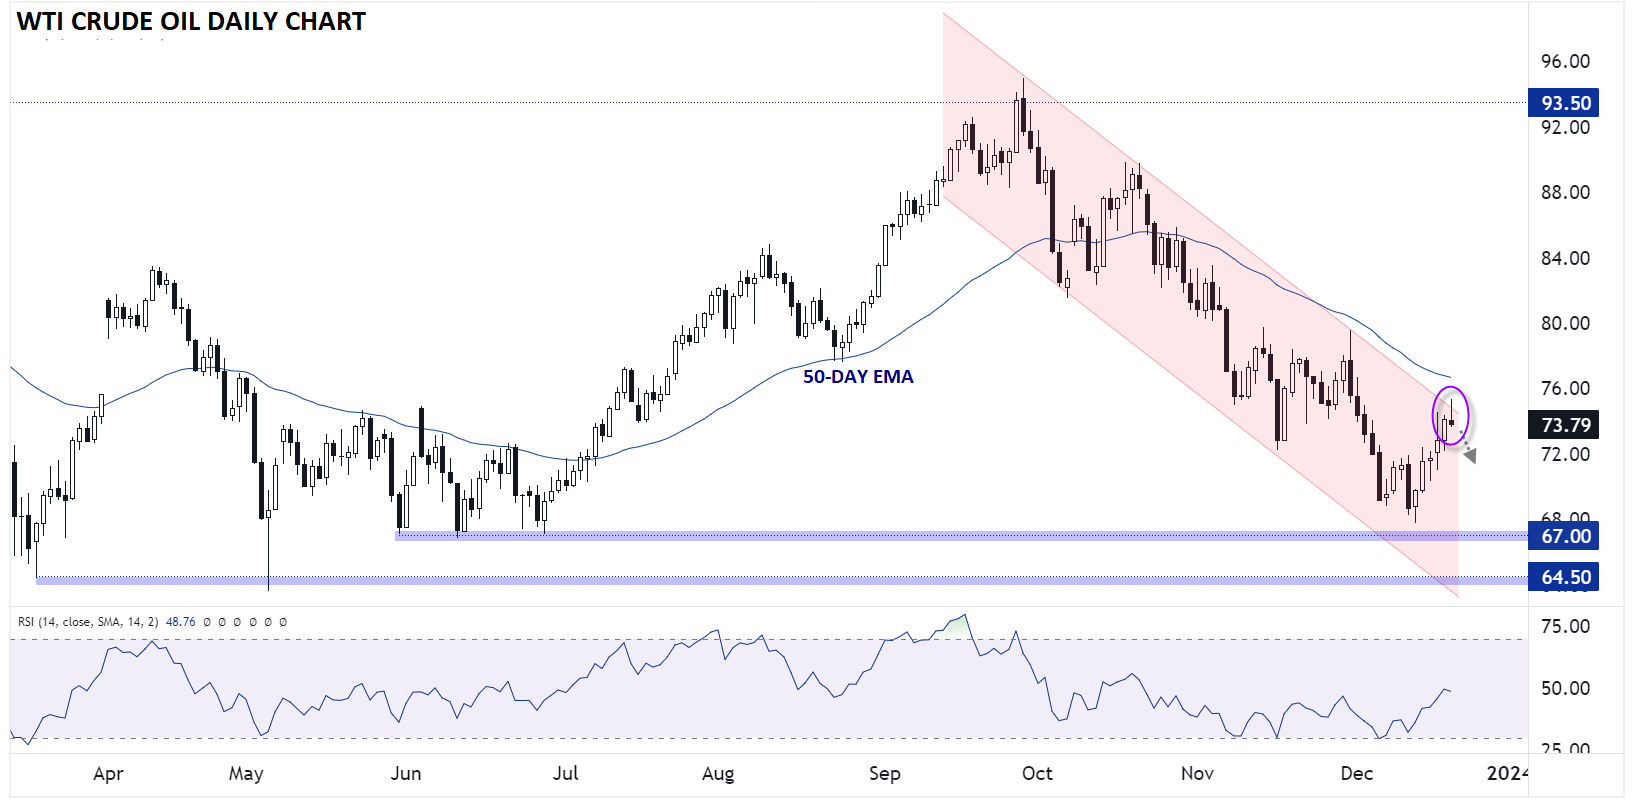
Source: TradingView, StoneX
West Texas Intermediate (WTI) crude oil prices reached as high as 75.30 earlier today before reversing back lower after the unexpected build in US inventories. The reversal took place at a key technical level, the top of the 3-month bearish channel and just below the downward-trending 50-day EMA.
Significant uncertainty remains around the situation in the Red Sea, but if tensions dissipate from here, WTI will likely resume its medium-term downtrend. In that scenario, it could revisit the early December lows under $70 sooner rather than later, with potential for a continuation down toward the H2 lows at $67 from there. Only a break above today’s high and the 50-day EMA near $76.50 would erase the current bearish bias.
Canadian Dollar Technical Analysis – USD/CAD Daily Chart
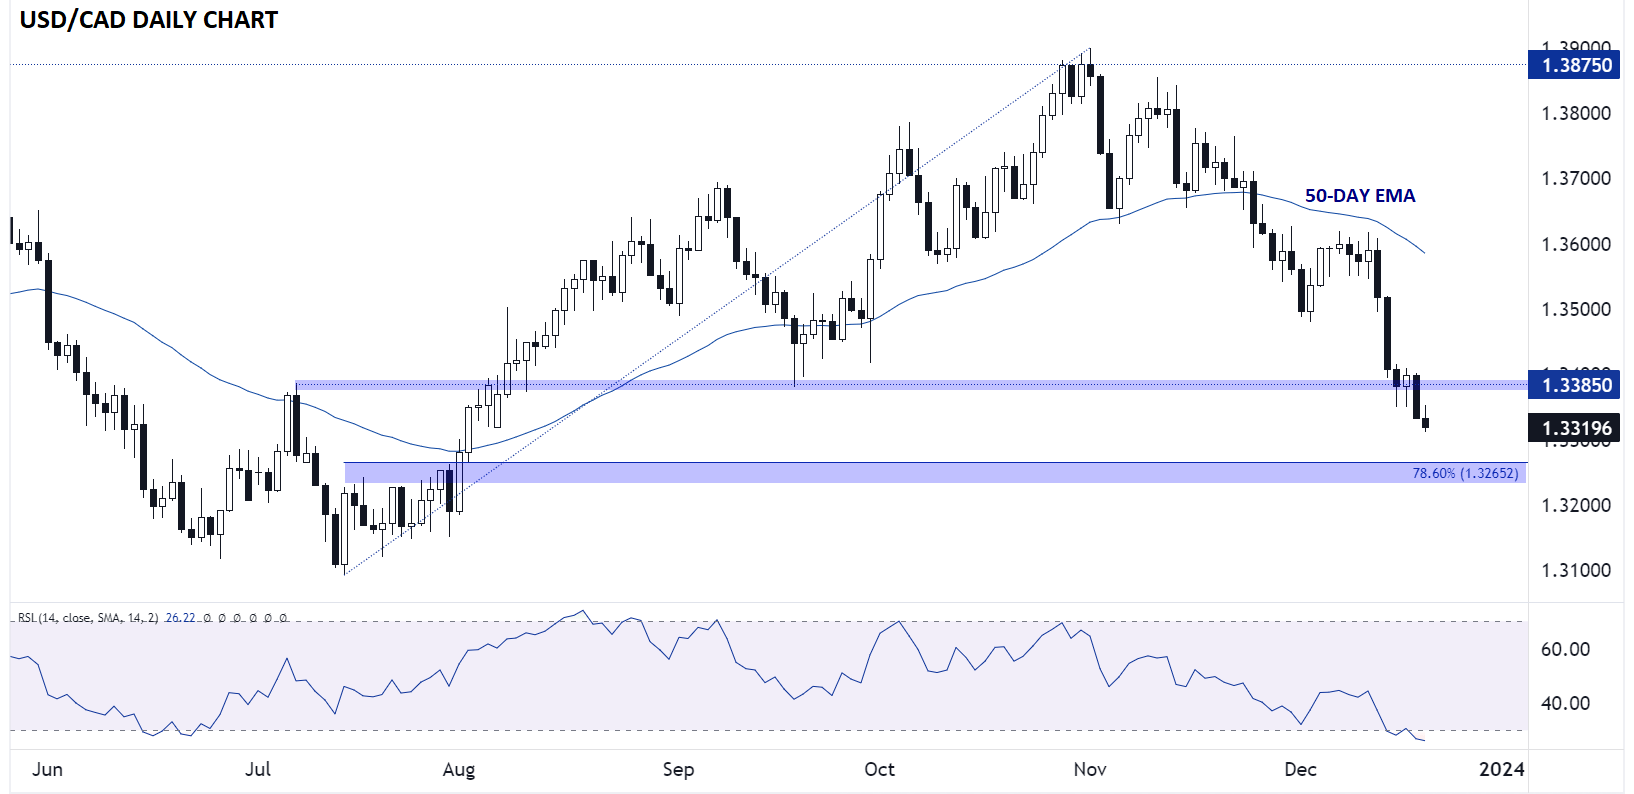
Source: TradingView, StoneX
Of course, any time we’re talking about oil, forex traders naturally think of the Canadian dollar. After all, oil is Canada’s most important export and there has been a strong historical correlation between the price of crude and the loonie (though that correlation may not necessarily hold as strongly in the future).
Looking at USD/CAD, the North American pair is falling for the fifth day in the past six to hit a 4-month low near 1.3300 as we go to press. The 14-day RSI is in oversold territory, suggesting that we could see a bounce ahead of the weekend, but the near-term trend clearly remains to the downside. The next level of support to watch is the 78.6% Fibonacci retracement of the July-November rally at 1.3265, whereas near-term resistance looms at 1.3385 if we do see a near-term bounce.
-- Written by Matt Weller, Global Head of Research
Follow Matt on Twitter: @MWellerFX
Latest market news
Yesterday 01:32 PM
Yesterday 09:35 AM
Yesterday 07:23 AM
Yesterday 04:48 AM
Yesterday 12:17 AM
July 25, 2024 10:39 PM
Latest Oil articles

July 24, 2024 09:55 AM
July 21, 2024 01:00 PM

July 19, 2024 01:23 PM

July 18, 2024 01:12 PM