Crude and Cad….to the moon?
India is under siege by the coronavirus. Cases are rising at an incredible pace, over 400,000 per day! Countries are rushing to send vaccines to help fight the pandemic. Other countries are also still dealing with continued outbreaks, such as Brazil, Argentina, Turkey, Japan, and Singapore. Yet, crude traders still feel there will be enough demand in higher income countries to push prices higher. In the US, nearly 33% of the population is vaccinated. In the UK, nearly 25% of the population is vaccinated. And in Europe, although starting slow, the vaccine rollout has picked up pace and the European 7-day vaccination rate is higher than that of the US, and still acceleration.
Last week, Goldman Sachs put out a research piece which said that due to higher vaccination numbers and higher demand for travel in Europe, oil demand could result in “the biggest jump in oil demand ever, a 5.2 million bpd rise over the next six months”! They added that they continue to see oil rising to $80 per barrel this summer.
What factors move the price of oil?
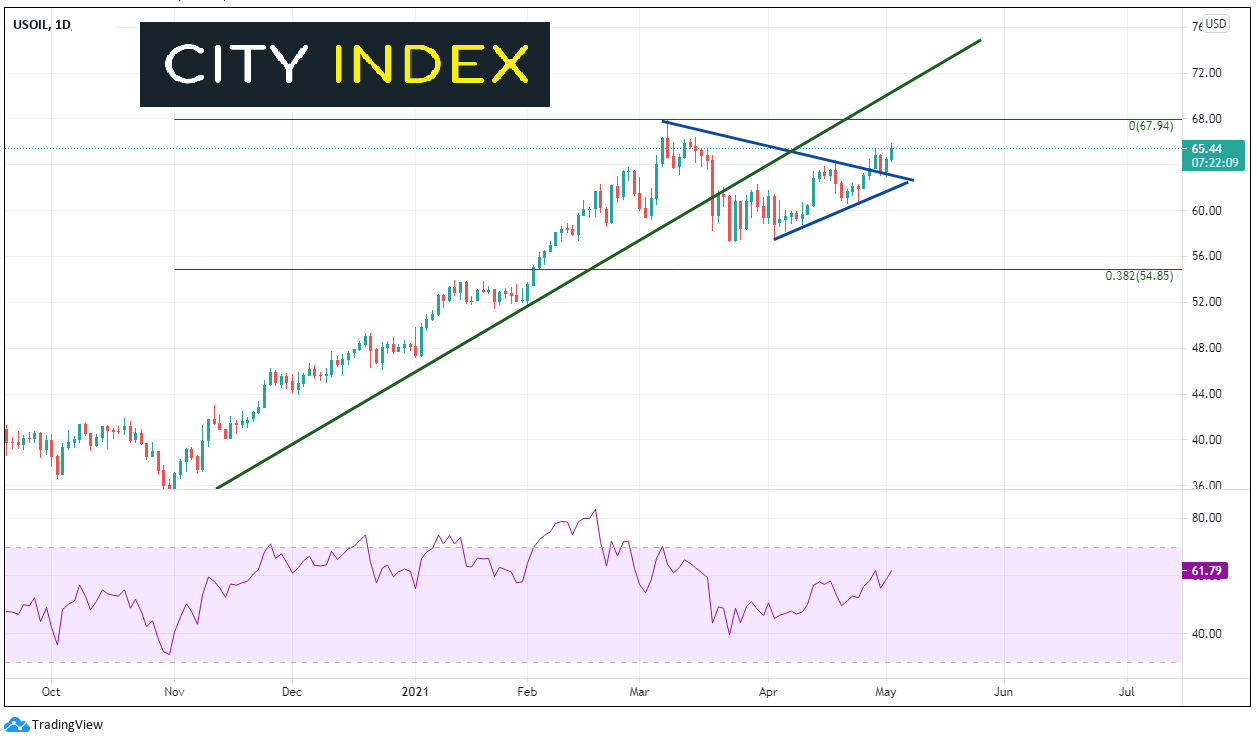
USOIL has on a tear since the pandemic lows of $0 on April 21st, 2020. Price oscillated around $40 last summer and autumn and began accelerating from November 2nd, 2020 when price was near 33.67. On March 8th, crude oil made a post-pandemic high at 67.94. The pullback was minor, as price couldn’t even retrace to the 38.2% Fibonacci retracement level from the November 2nd, 2020 lows to the March 2nd highs only falling to 57.28. Crude Oil formed a symmetrical triangle and closed above it on April 28th. With the expected increase in demand, crude oil is attempting to retest the March 2nd highs, currently trading near 65.50.

Source: Tradingview, City Index
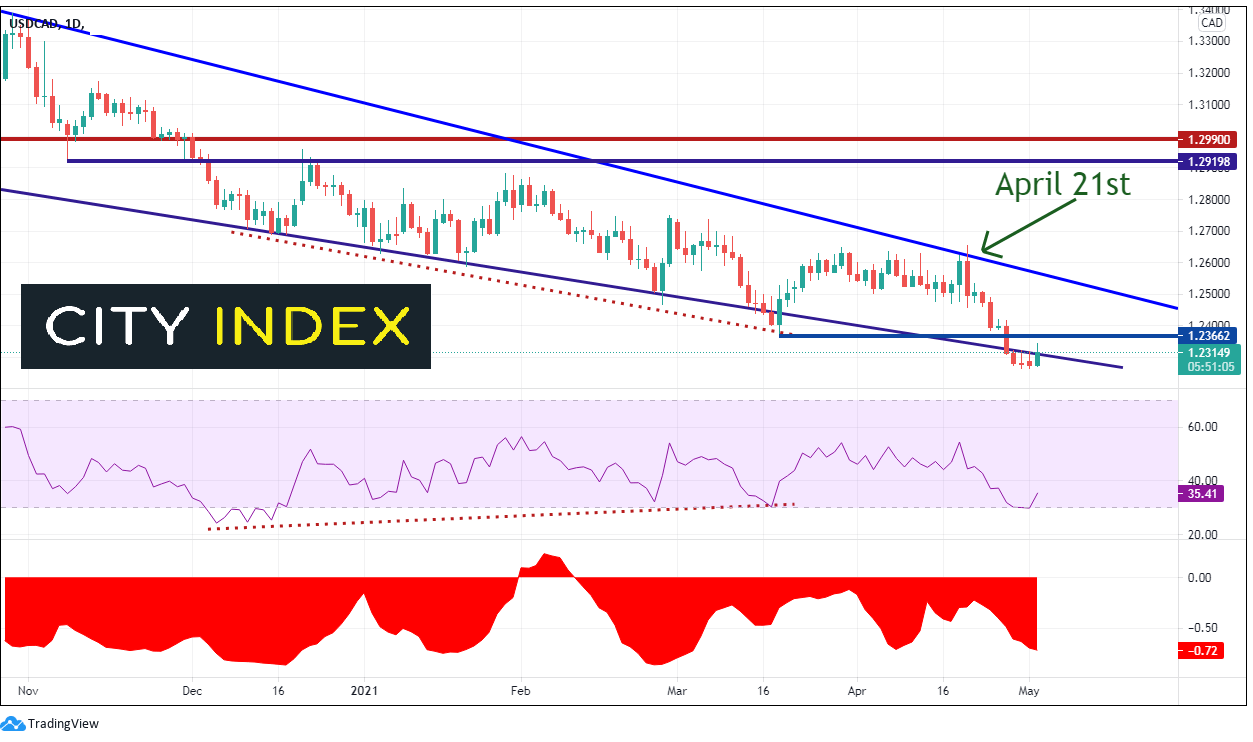
As Canada is primarily an oil export-led economy, the price of USD/CAD and US Oil is negatively correlated on the daily timeframe (most of the time). Sometimes its more negatively correlated than others, however as the price of Crude Oil rises, the price of USD/CAD usually falls. (See the correlation coefficient in red at the bottom of the chart below). The current correlation coefficient is -0.72. As such, with the price of oil moving higher over the last year, the price of USD/CAD has been moving lower. USD/CAD put in a pandemic high on March 19th, near 1.4467 and has been moving lower since, in a bullish wedge pattern. However, after a false breakout above the top downward sloping trendline on April 21st, price moved lower and took out the bottom trendline of the wedge on April 28th!

Source: Tradingview, City Index
The reason was two-fold:
- On April 21st, the Bank of Canada TAPERED and cut their weekly bond purchase amounts to C$3 billion per week from C$4 billion per week.
- The price of Crude Oil began moving higher in earnest, causing USD/CAD to move lower.
Learn more about the Bank of Canada
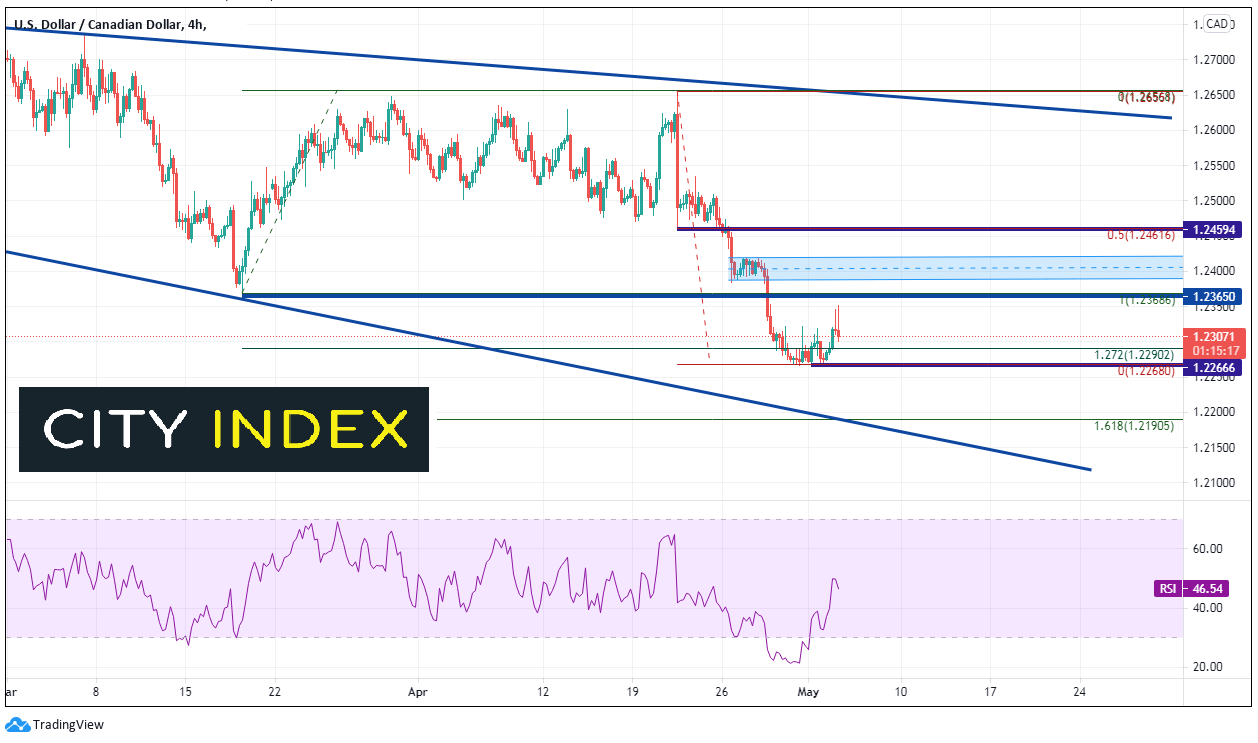
On a 240-minute timeframe, USD/CAD is bouncing a bit after holding the 127.2% Fibonacci extension from the March 18th lows to the April 21st high, near 1.2290. The actual low was 1.2266, however price failed to hold below the Fib extension. If price falls below there, it can run down to the 161.8% Fibonacci extension, which also confluences with a shorter-term, downward sloping trendline dating back to December 2020, near 1.2190. There is strong horizontal resistance above at 1.2366 and a zone of resistance between 1.1.2385 and 1.2410. Above there is a confluence of resistance at 1.2460, which is horizontal resistance and the 50% retracement from the April 21st highs to the April 28th lows.

Source: Tradingview, City Index
If USD/CAD is to continue to move lower, it may have to be on the back of Crude oil moving higher. However, with the higher expected demand for crude oil and with BOC tapering, a strong move in both assets could come sooner than later!
Learn more about forex trading opportunities.


