June 10, 2022 3:40 PM

US CPI for May was 8.6% YoY vs an expectation of 8.3% YoY and an April print of 8.3% YoY. This is the highest reading since December 1981. After the lower than expected reading in April (8.3% YoY vs 8.5% YoY expected) many were hoping to see signs of plateauing in the inflation reading this month. But it was not meant to be. Energy prices and food prices were the main culprits contributing to the higher inflation print. Energy prices rose 34.6%, the most since September 2005, while food prices were up 10.1%, the highest level since March 1981. However, the Core CPI for May, which excludes the often-volatile food and energy prices, was 6% YoY vs an expectation of 5.9% YoY and a reading of 6.2% YoY in April. This was the second month in a row that the Core CPI rose less than the previous month. The March reading was 6.5% YoY. Therefore, the data shows that inflation is contained to food and energy and hasn’t spilled over yet into the rest of the economy.
The US Dollar Index (DXY) has gone bid on the back of the higher CPI reading, which indicates the possibility of further aggressive tightening. On May 13th, the DXY hit its highest level since December 2002 near 105.00. The DXY then pulled back to the 50 Day Moving Average and the 50% retracement level from the lows of March 31st to the highs of May 13th, near 101.30. Since then, the US Dollar Index has been moving higher and today, broke above the 61.8% Fibonacci retracement level from the May 13th highs to the May 30th low near 103.59.
Source: Tradingview, Stone X
Trade the DXY now: Login or Open a new account!
• Open an account in the UK
• Open an account in Australia
• Open an account in Singapore
On a 240-minute timeframe, the US Dollar Index has formed an inverted Head and Shoulders pattern and broke above the neckline yesterday. The target for this pattern is the height from the head to the headline, added to the breakout level above the neckline. In this case it is near 104.30. As mentioned, today, price broke above the shorter-term 61.8% Fibonacci retracement level near 103.59. There is isn’t any resistance between 103.59 and the inverted head and shoulders target. The next horizontal resistance is at the May 13th low, near 104.57, then the previous highs at 105.00. Above there, price can move to horizontal resistance from September 2002 at 105.41. (see daily). However, notice the RSI is in overbought territory, an indication that price may be ready for a correction. First support is at the neckline of the pattern near 103.15. Below there, horizontal support sits at 102.83, then the spike lows from June 9th at 102.15.
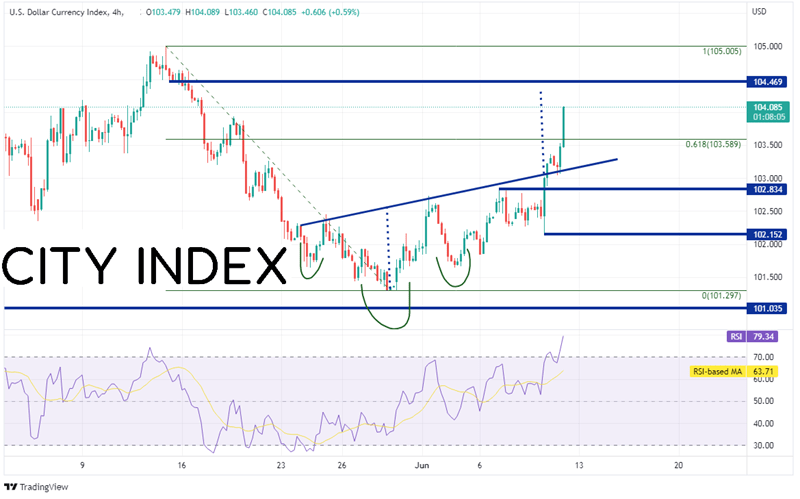
Source: Tradingview, Stone X
As the Euro makes up 57% of the DXY, EUR/USD trades in the opposite direction of the DXY. On a 240-minute timefame, the pair is testing the 61.8% Fibonacci retracement level from the low of May 13th to the highs of May 30th near 1.0516. Horizontal support below is at the lows from May 18th at 1.0459, then the May 13th lows at 1.0349, only 9 pips above the January 2017 lows. Notice the RSI on 240-minute timeframe is in oversold territory, indicating EUR/USD may be ready to bounce. Resistance is at today’s high of 1.0642. Above there, price can move to the long-term downward sloping trendline (green) near 1.0735.
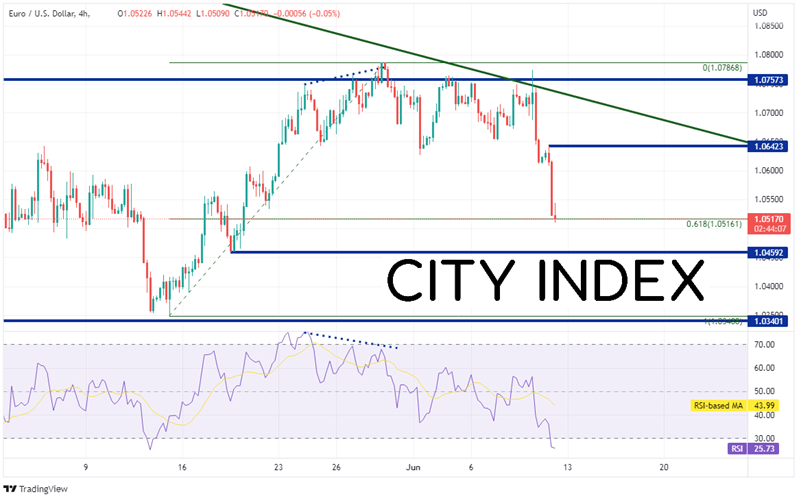
Source: Tradingview, Stone X
Trade EUR/USD now: Login or Open a new account!
• Open an account in the UK
• Open an account in Australia
• Open an account in Singapore
The US CPI for May came in at its highest level since December 1981. The reaction in the markets is a stronger US Dollar and a lower EUR/USD, which insinuates a call for more aggressive tightening from the Fed. Will the Fed listen when it meets next week? Stay tuned!
Learn more about forex trading opportunities.
Latest market news
Yesterday 01:32 PM
Yesterday 09:35 AM
Yesterday 07:23 AM
Yesterday 04:48 AM
Yesterday 12:17 AM
July 25, 2024 10:39 PM
Latest Forex articles

Yesterday 12:17 AM

July 25, 2024 10:39 PM

July 25, 2024 03:59 PM

July 25, 2024 04:37 AM