

Canadian Dollar, USD/CAD Talking Points:
- USD/CAD has been in a massive bullish move over the past two months, and last week produced a fresh five-month-high while bringing a re-test of a key Fibonacci level at 1.3652.
- While bulls did test beyond that level to set a fresh five month high, they couldn’t sustain the move, and prices pulled back below that level ahead of the weekly close, and so far this week we’ve seen sellers continue that push.
- I’ll be discussing these themes in-depth in the weekly webinar on Tuesday at 1PM ET. It’s free for all to register: Click here to register.
USD/CAD had a strong bullish trend develop after setting a fresh low in early-July. It didn’t start that way after the trendline showed support on July 14th, to be sure, as there was that struggle between late bears and early bulls that held for a couple of weeks. But by the August open USD/CAD buyers had pushed price out of a falling wedge formation to produce a fresh breakout and that move ran strong, into a fresh high just last week.
As USD-strength continued into September trade that trend held strong in USD/CAD, with the pair showing even more bullish behavior to highlight the inclusion of CAD-weakness to an already strong USD. But, as I had noted in the webinar last week, there was a major level coming into play at the 1.3652 level, which is a Fibonacci level that’s already produced multiple inflections so far this year: As support in Q1 and then as resistance through multiple episodes in Q2. I had also touched on this in that webinar last Tuesday but there’s also been a slowing of the trend in USD/CAD when compared to DXY, which highlights the entrance of CAD-strength into the mix.
That resistance at 1.3652 traded Tuesday-Thursday last week, with bears taking control on Friday to push price back below that level into the weekly close.
USD/CAD Weekly Price Chart
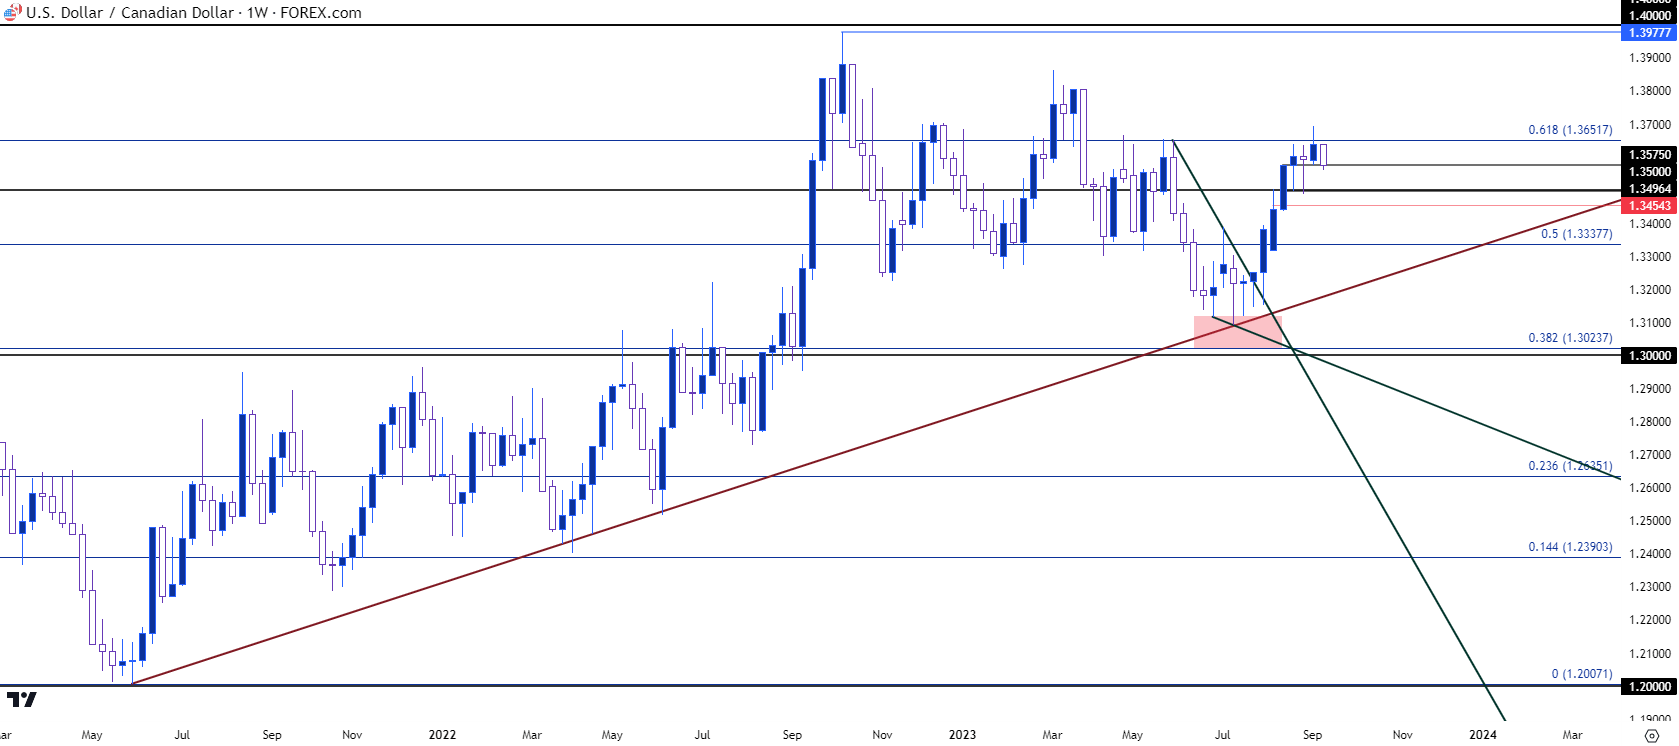 Chart prepared by James Stanley, USD/CAD on Tradingview
USD/CAD Daily
From the daily chart the sequencing of higher-highs and higher-lows remains intact. Price is now testing a higher-low at a prior spot of resistance as taken from the 1.3575 swing, but really it’s the spot around 1.3500 that remains so key for bullish continuation scenarios. Similarly, this was a spot of resistance in early-August that was soon coming-in as support. And this held support inflections for two consecutive weeks, until last week’s failed attempt to breakout.
If bulls are unable to defend this level any longer, questions will populate on bullish continuation potential and the door may even soon open to reversal potential.
While USD remains strong in many other markets, including in DXY, this highlights how there may be more attractive major markets for continued scenarios of USD-strength, while USD/CAD may soon become an attractive setup for US Dollar bears.
USD/CAD Daily Price Chart
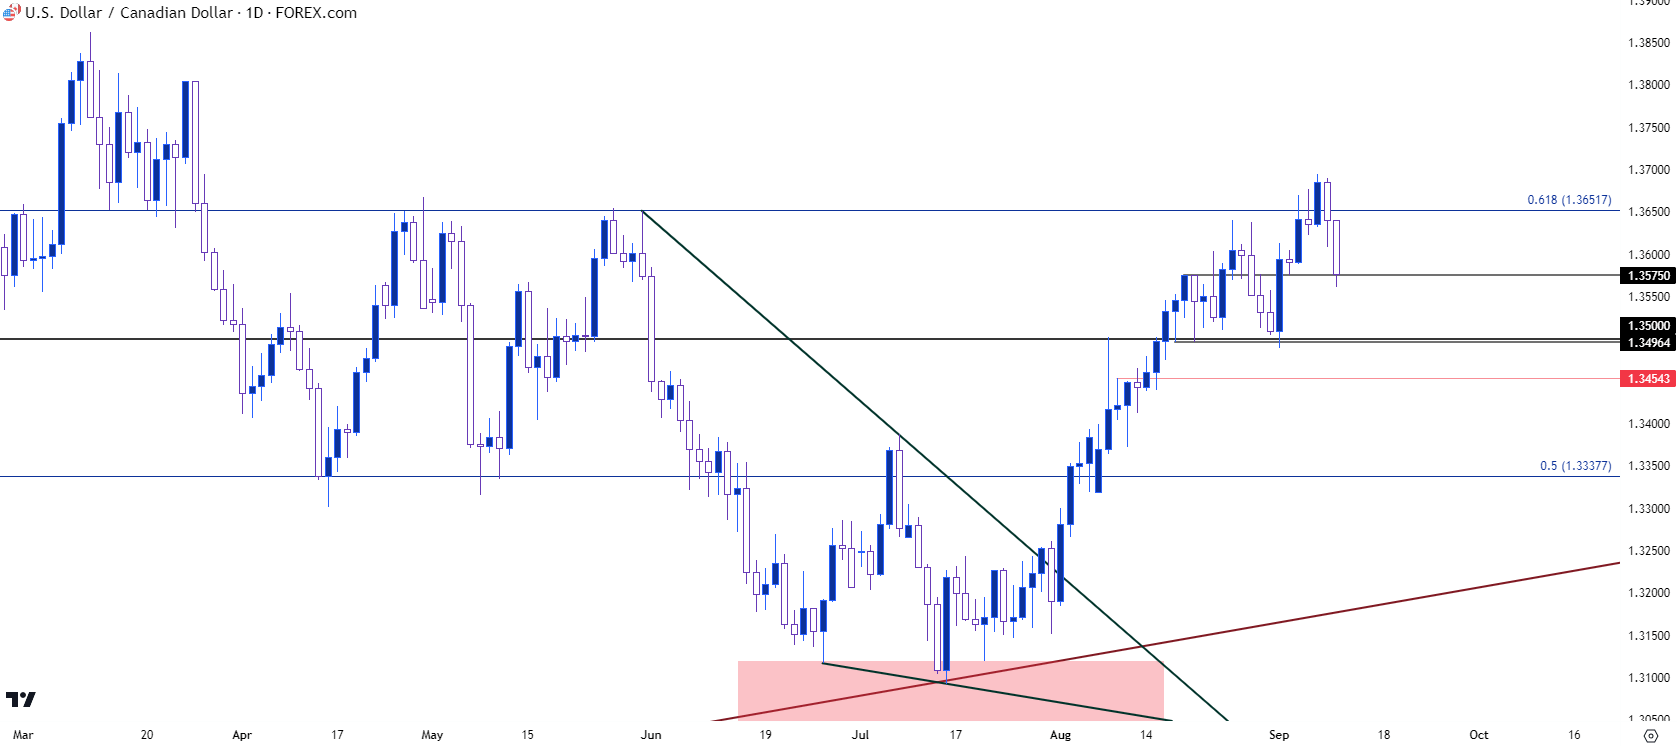 Chart prepared by James Stanley, USD/CAD on Tradingview
--- written by James Stanley, Senior Strategist
Latest market news
Yesterday 01:32 PM
Yesterday 09:35 AM
Yesterday 07:23 AM
Yesterday 04:48 AM
Yesterday 12:17 AM
July 25, 2024 10:39 PM
Latest Trade Ideas and Alerts articles

May 1, 2024 04:50 PM

April 16, 2024 04:24 AM

April 15, 2024 06:08 AM

December 14, 2023 06:06 PM