

GBP/USD, British Pound Talking Points:
- It’s been a strong rally in GBP/USD over the past two days, with the pair finding support at the familiar 1.2500 level on Wednesday and then shooting through resistance at 1.2750 a day later.
- The Bank of England wasn’t as dovish as the FOMC this morning, saying that rates will stay ‘sufficiently restrictive for sufficiently long,’ and that’s helped to drive the move. That disparate take between the Fed and the BoE could keep upward pressure on the British Pound as markets price the end of rate hikes in the US. It also opens up a scenario in GBP/JPY, which is currently gripping the 180 psychological level for support, ahead of the Bank of Japan rate decision next week.
It’s been a busy few days across markets and the end of year is now in sight, with a few high-impact releases on the calendar for next week, including the Bank of Japan rate decision.
Given the outlay from the Central Banks that we’ve heard from, with the Fed meeting on Wednesday afternoon leading into the European Central Bank and the Bank of England this morning, there was a clear disparity. The Fed sounded dovish, with Powell admitting that conversations about rate cuts have already begun. The ECB a bit less so, saying that they haven’t yet talked about rate cuts, but they did reduce their forecasts for inflation next year to 2.7% from a prior 3.2% read. The Bank of England, however, sang a familiar refrain that we’d previously heard from the Fed, saying that they anticipated keeping rates in sufficiently restrictive territory for sufficiently long, implying that rate cuts aren’t even in the conversation yet.
And given current core CPI reads, this outlay makes sense. The most recent UK Core CPI reading in November printed at 5.7%. Meanwhile Eurozone Core CPI last printed at 3.6% and in the US Core CPI has remained at 4.0%. So, directly, the UK and the Bank of England have more work to do when compared to the US or Europe, and this could continue to put upward pressure on the British Pound as the inflation fight continues.
In GBP/USD, I had remarked in the Tuesday webinar that the pair has shown a rather clean outlay with simple support and resistance levels. And that’s continued, with yesterday’s pullback showing support at the 1.2500 psychological level, which pushed an explosive move on Wednesday up to resistance at 1.2590. Bulls weren’t done yet as the larger push came the morning after as helped along by the BoE, and GBP/USD is now trading at a fresh three month high, testing through a wide zone of confluent resistance that previously held two inflections.
GBP/USD Daily Price Chart
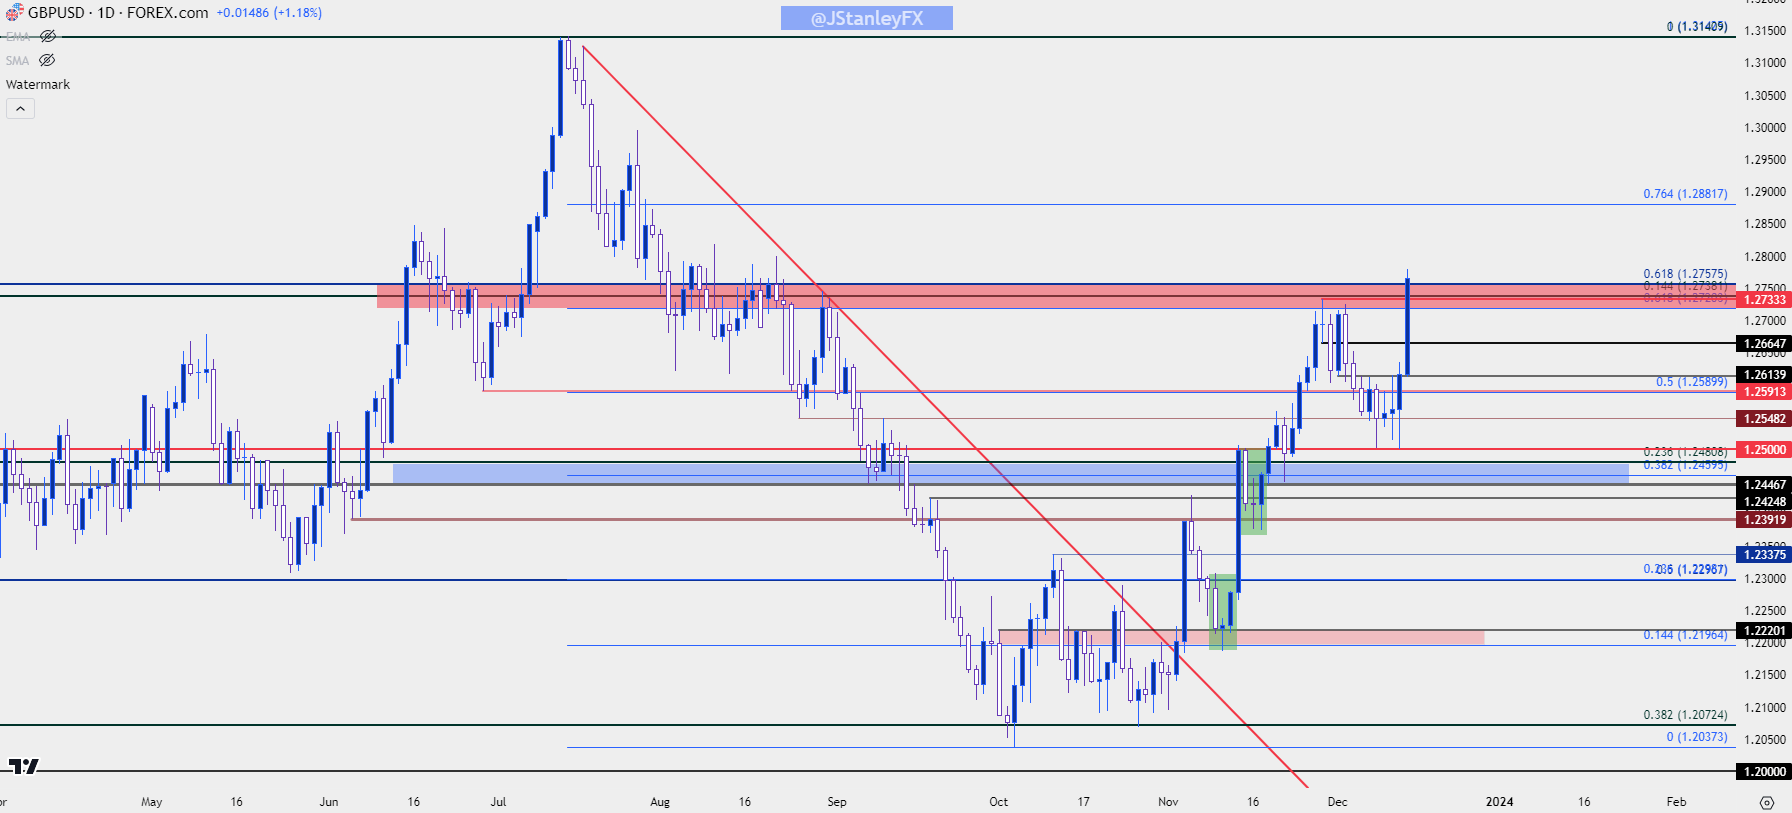 Chart prepared by James Stanley, GBP/USD on Tradingview
GBP/USD Longer-Term
The weekly chart is of interest here as this week has, so far, shown a strong topside move that continues the bigger picture trend. This week’s low is slightly lower than the prior week, so the current outlay can be qualified as a bullish outside bar and bulls would need to hold the move above the 1.2720 level by the end of the week to keep that alive.
The 1.3000 level is the next significant resistance level sitting above current price, with a shorter-term zone of interest spanned from 1.2848 up to 1.2882.
GBP/USD Weekly Price Chart
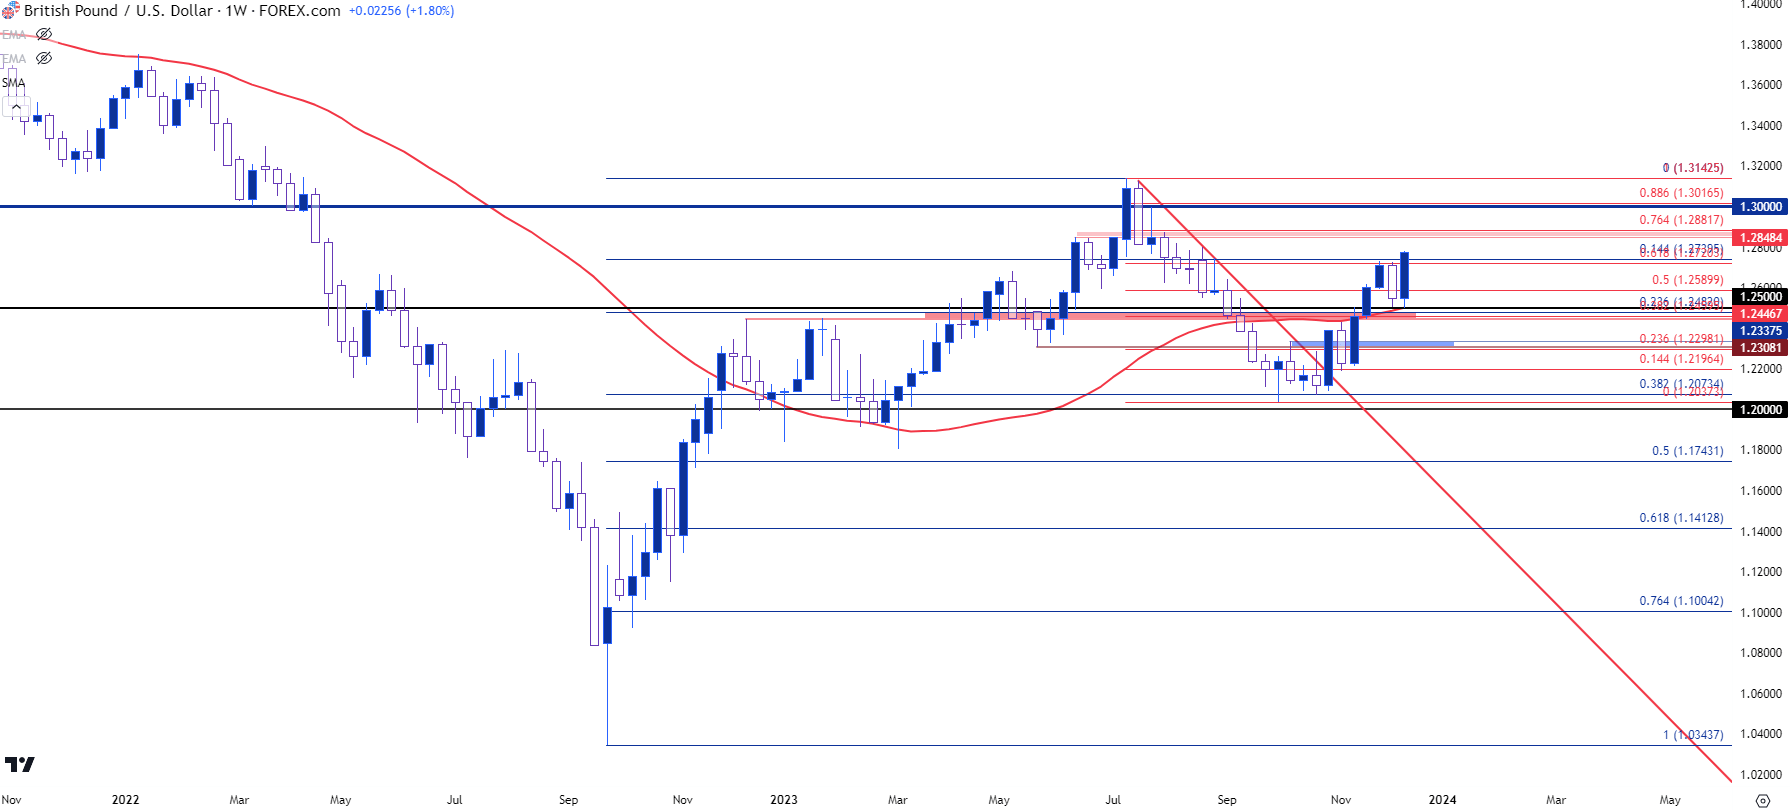 Chart prepared by James Stanley, GBP/USD on Tradingview
GBP/USD Shorter-Term
The move has been explosive over the past two days and chasing this could produce challenge. Perhaps as impressive if not moreso is the area where this has taken place, as the 1.2720-1.2758 zone held two inflections in late-November and early-December, with price retracing all the way back to 1.2500 before resuming its climb.
But – this also shows some support potential and when/where bulls re-enter could be telling for how aggressive they’ll remain to be. The price of 1.2758 is the 61.8% Fibonacci retracement of the 2021-2022 move, while the 1.2720 is the 61.8% marker of the more recent sell-off that started in July.
GBP/USD Four-Hour Chart
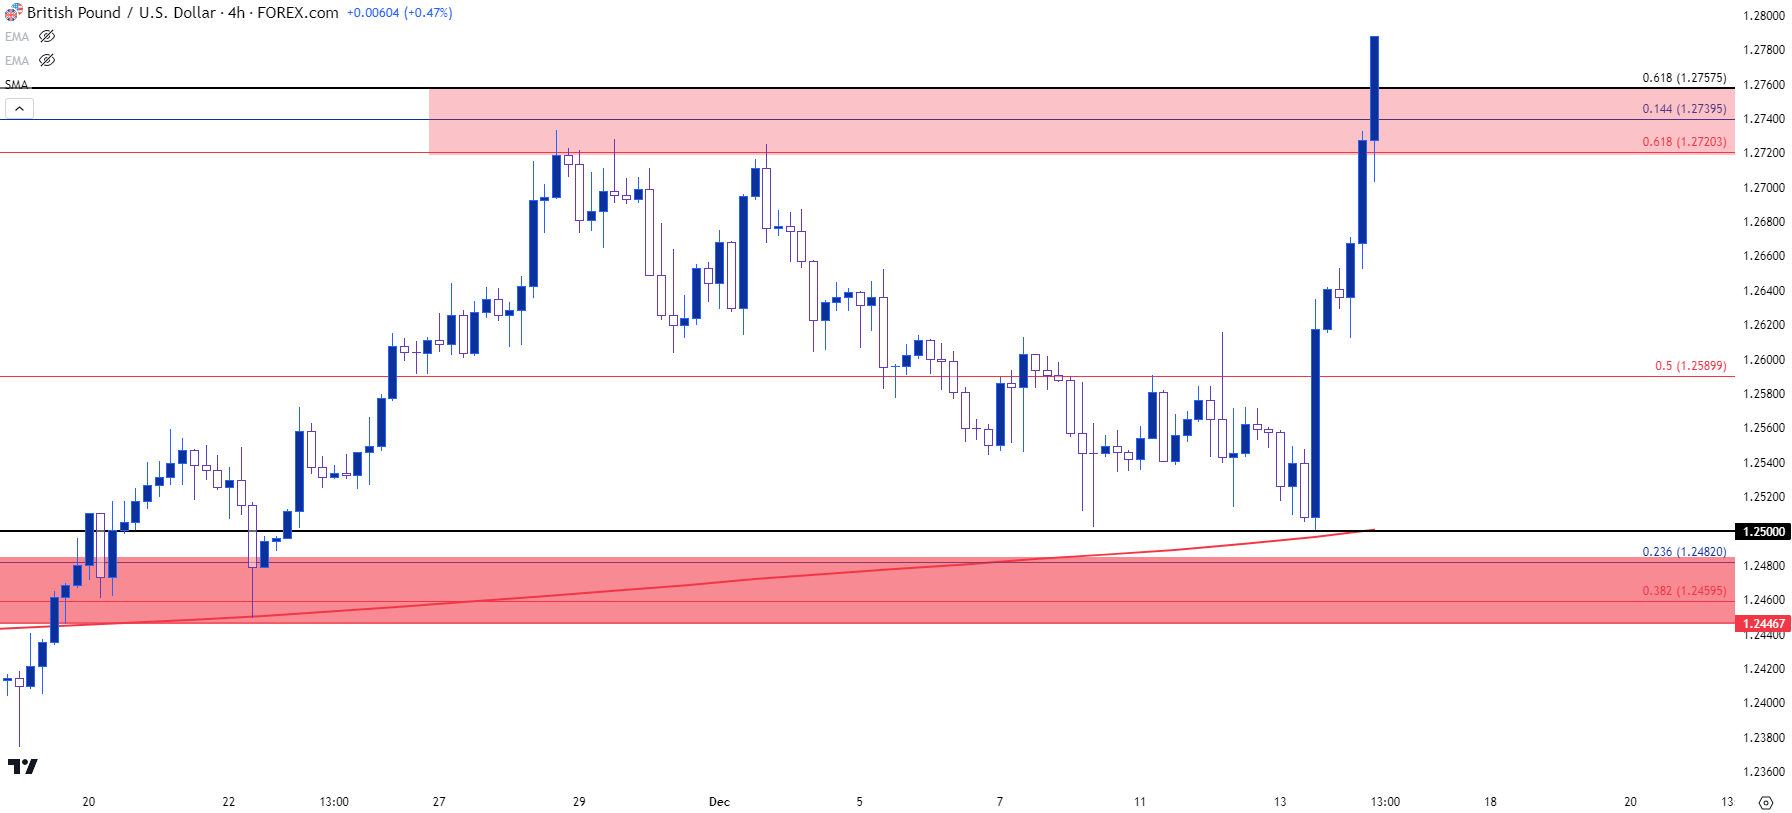 Chart prepared by James Stanley, GBP/USD on Tradingview
GBP/JPY
The Central Bank fireworks aren’t over for December as the Bank of Japan is still waiting in the wings for early next week. And there’s been hints of change on the horizon, although timing remains a complication. Japanese inflation has continued to show and the BoJ still hasn’t moved off of their negative rate policy. There’s been hints that this may be changing but the BoJ, so far, has been evasive on any actual details of when, where or how they might be planning to do so.
That continued dovishness has allowed JPY to remain as relatively weak for much of the past couple years, but as winds of change begin to show elsewhere the natural question is whether something similar might begin to show in Japan.
USD/JPY has already dropped by more than 1,000 pips since the November CPI report: And the Fed hasn’t even talked about rate cuts yet. The simple fact that the Fed may be done has been enough to terrify carry traders and this can cause unwind as a fear of principal losses obviates the attractiveness of rollover from the rate divergence offered by the underlying economies in the pair.
This is what explains the pattern of Yen-strength in Q4 of last year: The Bank of Japan remained dovish throughout, but it was the dynamics elsewhere that caused mean reversion in the USD/JPY trend. This was less profound in GBP/JPY but the strength in the pair really started to show in 2023 as GBP/USD continued to climb for much of the year.
In GBP/JPY, with the BoE retaining a relative degree of hawkishness, the pair could outperform if the Bank of Japan sidesteps the negative rate issue at next week’s Central Bank meeting. At this point the par retains a mean-reverting nature and price has just put in another bounce from the 180.00 psychological level.
The monthly chart illustrates this well, where long-term resistance remains a bit higher, around the 195.00 level that had last come into play in June of 2015, about a year before the Brexit referendum.
GBP/JPY Monthly Price Chart
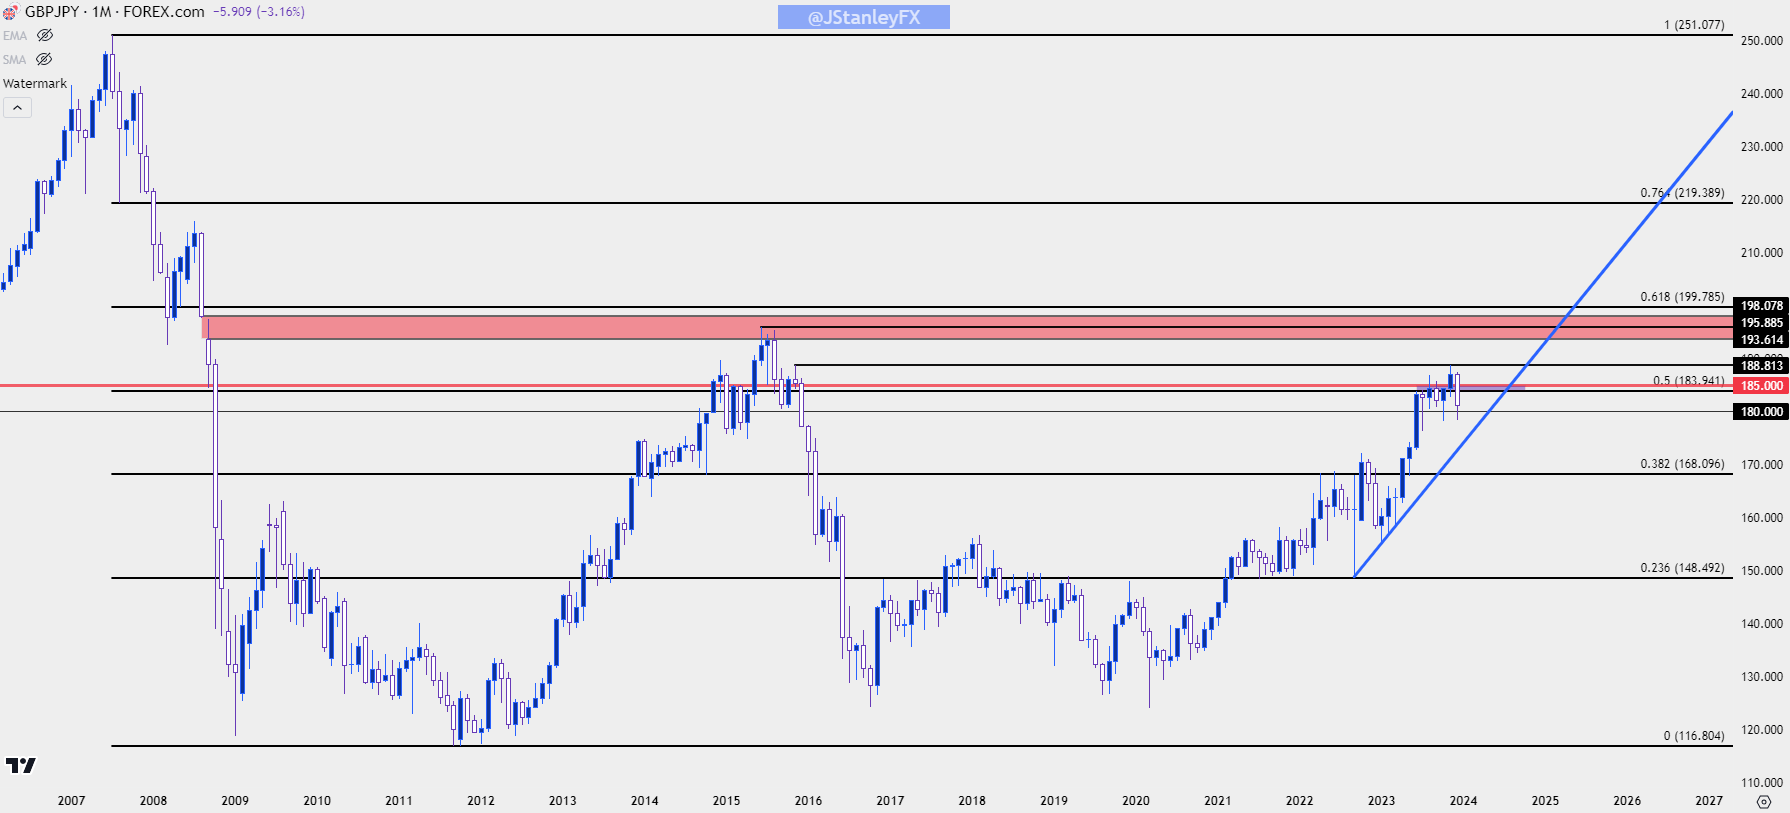 Chart prepared by James Stanley, GBP/JPY on Tradingview
GBP/JPY Shorter-Term
On a shorter-term basis a big area exists around 183.94, which is the halfway point of the major move looked at above. That price has so far helped to hold the weekly high and at this point presents a possible lower-high. If bulls can take that out, the 185.00 handle would be next resistance.
GBP/JPY Daily Price Chart
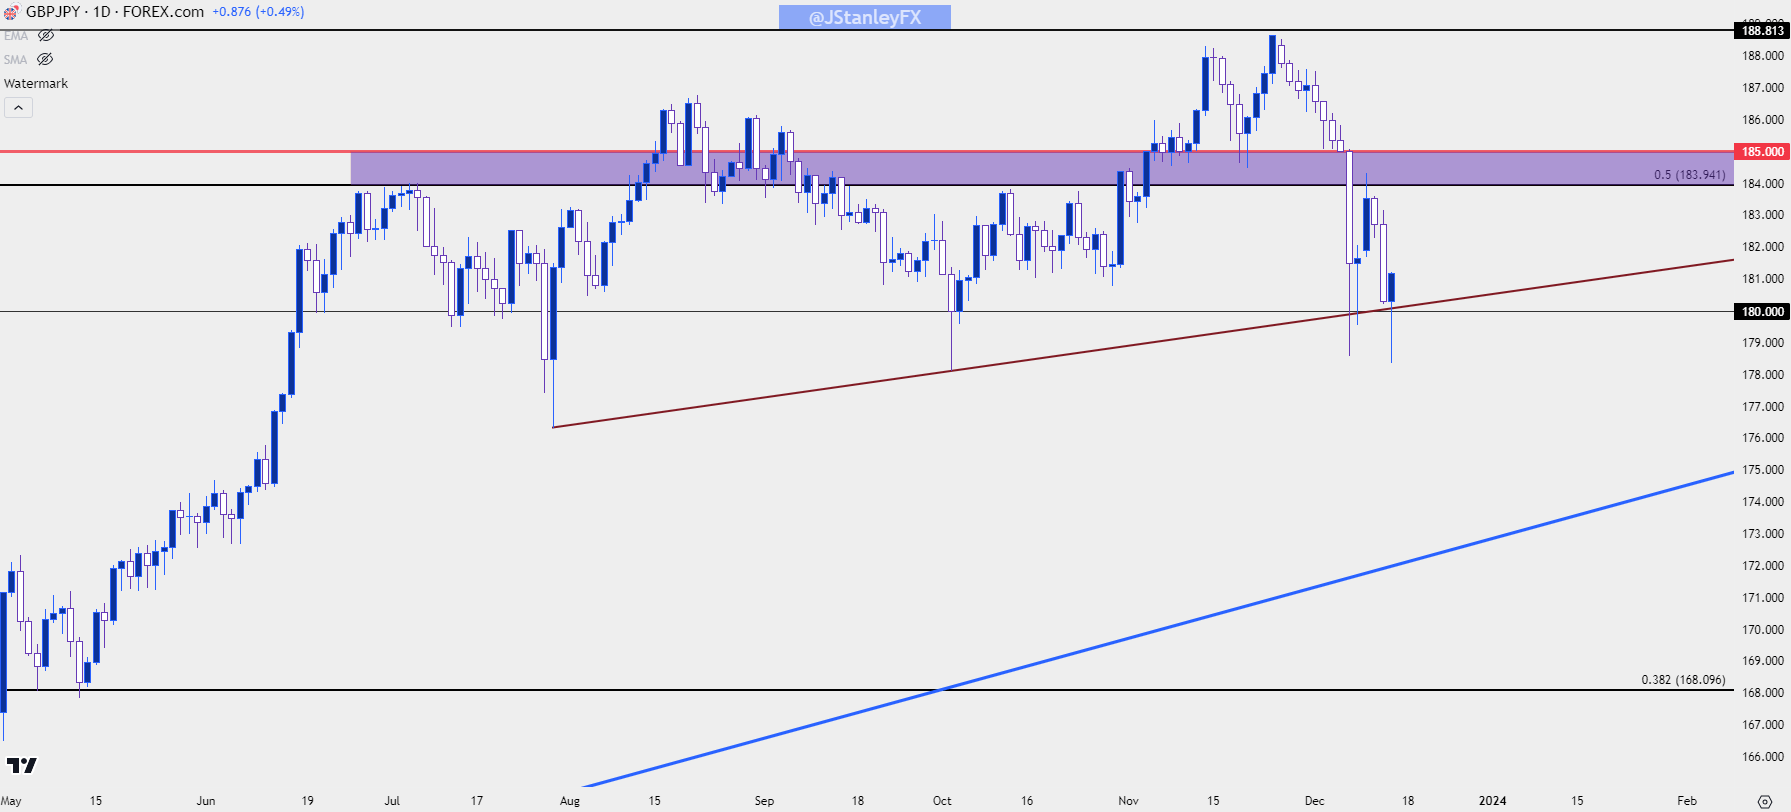
Chart prepared by James Stanley, GBP/JPY on Tradingview
--- written by James Stanley, Senior Strategist
Latest market news
Yesterday 01:32 PM
Yesterday 09:35 AM
Yesterday 07:23 AM
Yesterday 04:48 AM
Yesterday 12:17 AM
July 25, 2024 10:39 PM
Latest Trade Ideas and Alerts articles

May 1, 2024 04:50 PM

April 16, 2024 04:24 AM

April 15, 2024 06:08 AM

December 14, 2023 06:06 PM