May 11, 2022 7:30 PM

As the coronavirus hit China in February 2020, Silver (XAG/USD) sold off and reached a low of 11.64. However, by the week of August 3rd of that same year, as gold was making all-time highs, silver bounced to its highest level since February 2013, near 29.85. Since then, Silver has been moving lower in a descending triangle, with the exception of the week of February 1st, 2021 when the folks from Wall Street bets got a hold of the metal and drove the price briefly above the top trendline to a new local high of 30.08. With interest rates and the US Dollar rising over the past 3 weeks though, Silver has taken a turn to the downside. This week, price has traded through the bottom trendline of the descending triangle, reaching its lowest level since July 2020 and just above horizontal support dating to the week of July 1st, 2016, near 21.14.
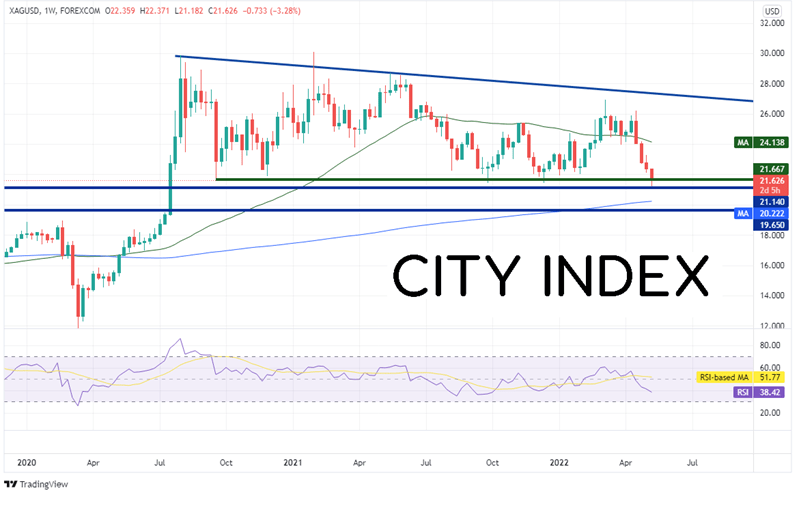
Source: Tradingview, Stone X
On a daily timeframe, one can get a clearer picture of just how much Silver has fallen since April 18th, when price was trading at high as 26.22. Since then, the precious metal has lost over 19%! If price can break through the horizontal support level of 21.14, it can fall to the 261.8% Fibonacci extension from the low of April 6th to the highs on April 18th near 20.74. Below there, price can fall to the 200 week Moving Average at 20.22 (see weekly chart). However, notice that the RSI is in oversold territory, an indication that price may be ready for a bounce. Horizontal resistance from the May 2nd low sits just above at 22.12. If price breaks above, additional horizontal resistance is at 23.28 and then the 200 Day Moving Average at 23.69.
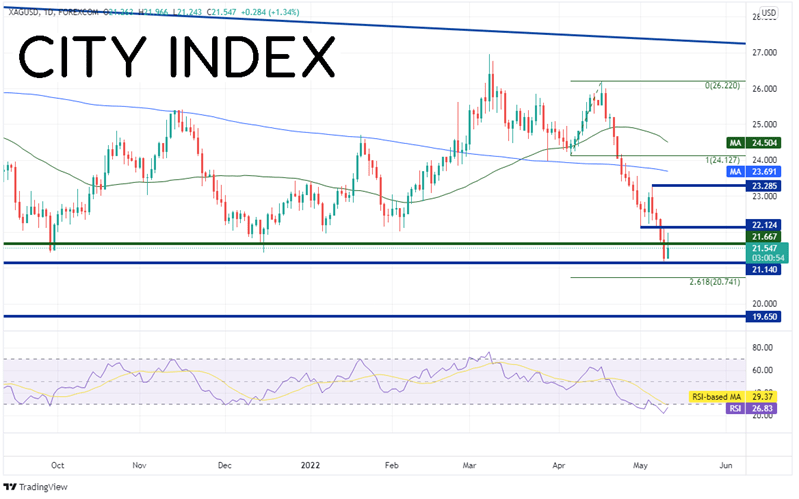
Source: Tradingview, Stone X
Trade Silver now: Login or Open a new account!
• Open an account in the UK
• Open an account in Australia
• Open an account in Singapore
Silver (XAG/USD) has tumbled over 19% since April 18th. Will the fall continue, or the yesterday’s move prove to be a false breakdown below the long-term horizontal support from the descending triangle? If price can hold yesterday’s low of 21.18 and the long-term support, there may be some hope for the precious metal!
Learn more about metals trading opportunities.
Latest market news
Yesterday 01:32 PM
Yesterday 09:35 AM
Yesterday 07:23 AM
Yesterday 04:48 AM
Yesterday 12:17 AM
July 25, 2024 10:39 PM
Latest Trade Ideas articles

Yesterday 09:35 AM

Yesterday 12:17 AM

July 25, 2024 10:39 PM

July 25, 2024 05:30 PM