

- US bonds staged a big turnaround on Thursday, generating a bullish technical signal
- There was no definitive catalyst, but it came ahead of key inflation data in the US
- Should the bond bounce stick, it could set the tone for multiple asset classes heading into yhear-end
- TLT, USD/JPY, USD/CNH are standout markets to play reversal in bond yields
Bonds bounce hard, reversing big early selloff
Whether it was Ray Dalio or Peter Schiff warning of a debt crisis, about every second post on ‘X’ being bearish on bonds, a large intraday reversal in crude, safe-haven buying ahead of a likely US government shutdown or simply reflective of stretched positioning before quarter-end, something strange happened in US Treasuries on Thursday: prices went up, sending yields lower.
Jokes aside, the price action caught my eye, especially the moves in the longer end of the US bond curve that resembled a crime scene earlier this week given the amount of blood that had been shed. A savage early sell-off was reversed and then some, seeing yields end trade well below where they started. It felt like a blow-off top often seen at a turning point, backed up by bearish daily pins printing for yields on 10, 20 and 30-year notes.
Some tried to pin the reversal on the US economic data which came in slightly softer than expectations, or comments from a well-known FOMC dove, Austan Goolsbee, that should surprise no one who has listened to what he’s said in the past. Both reflect price driving narrative, not the actual reason we saw the sudden reversal in bonds.
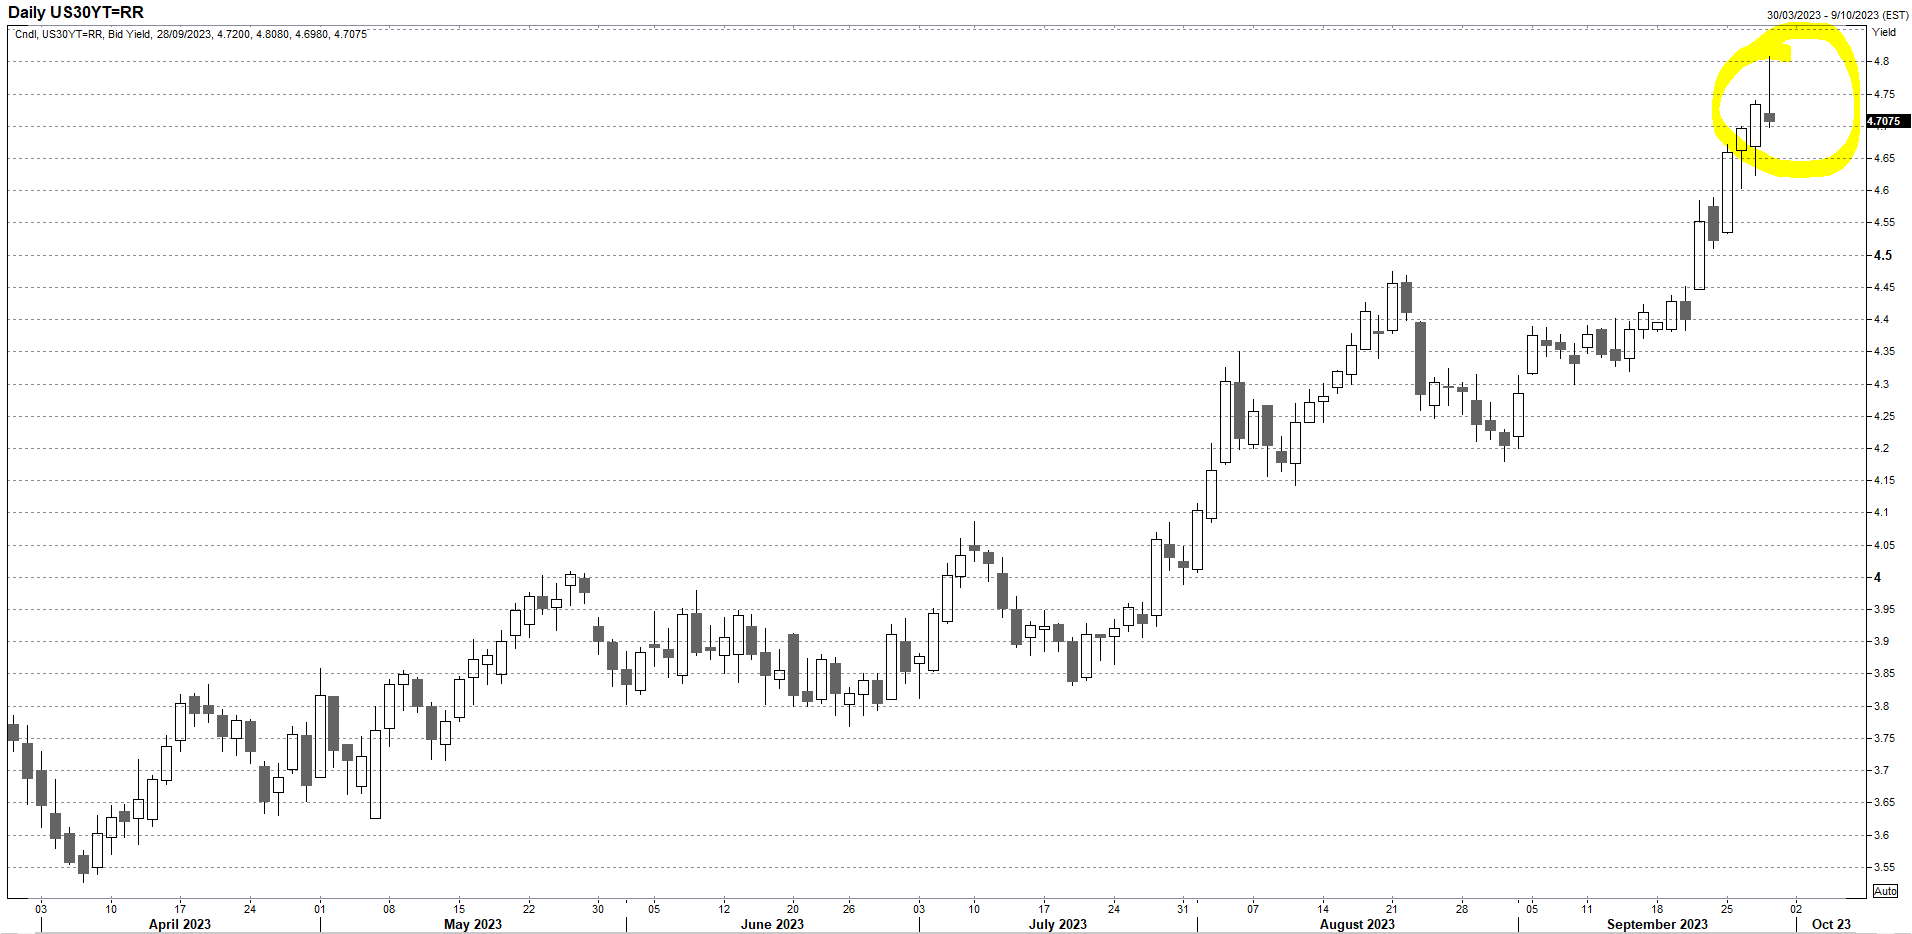
Source: Refinitiv
A big note of caution for potential bond bulls
Being so close to quarter-end, you cannot read too much into the price action on just one day. For example, gold – an asset class that had been hammered on higher yields and a stronger US dollar – was duly hammered again despite the reversal yields and dollar, underlining why traders should be cautious on how they should interpret the bond bounce.
But, coming only hours before arguably the most important data release for the US interest rate outlook – core PCE deflator – the next couple of days will be very, very important when it comes to asset class performance in the final three months of the year.
TLT bounces from key support
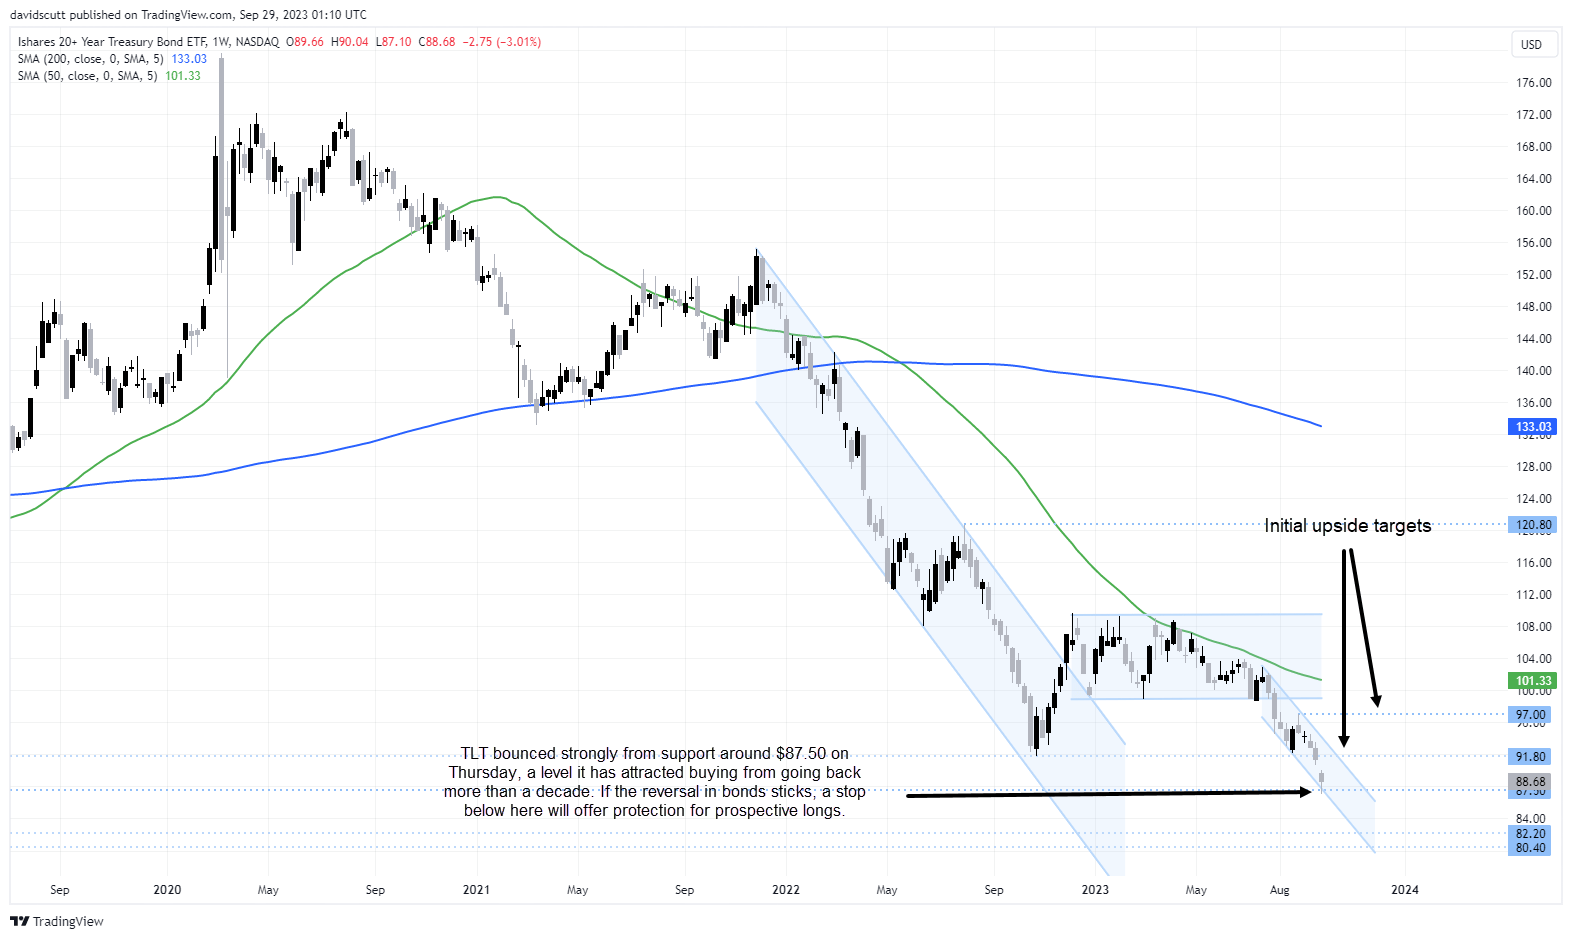
Unsurprisingly given the move in long bonds, TLT –- iShares’ 20+ Year Treasury Bond ETF – experienced a similar performance, bouncing strongly off a decent support zone that’s been in place for over a decade. Some traders may be convinced by the big reversal but there’s no need to try and pick the bottom for bonds just yet. TLT has fallen a long way and still looks sick on the charts, so prospective bulls may want to wait to see if the bounce sticks before taking a long position. As has been seen over numerous cycles, when bond trends change, they can continue for years or even decades.
Prospective longs could wait to see whether Thursday’s low holds over the coming days given its technical significance, then enter a long position with a stop below $87.50 for protection. The first upside target would be $91.80 and then again at $97. Should Thursday’s reversal not mark a turning point, downside levels to watch for TLT include $82.20 and $80.40, the latter being its current low.
USD/JPY, USD/CNH likely to benefit on lasting bond bounce
Aside from that option, those looking to play for a potential reversal in bonds have other options that offer decent risk reward having been hammered by the bond bloodbath recently. In the FX universe, USD/JPY and USD/CNH both standout given how influential yield spreads with the United States have been on their performance this year. Importantly, both the Bank of Japan (BOJ) and People’s Bank of China (PBOC) have been either intervening or threatening to intervene to counteract US dollar strength, adding an extra layer of fundamental support for those seeking to go short.
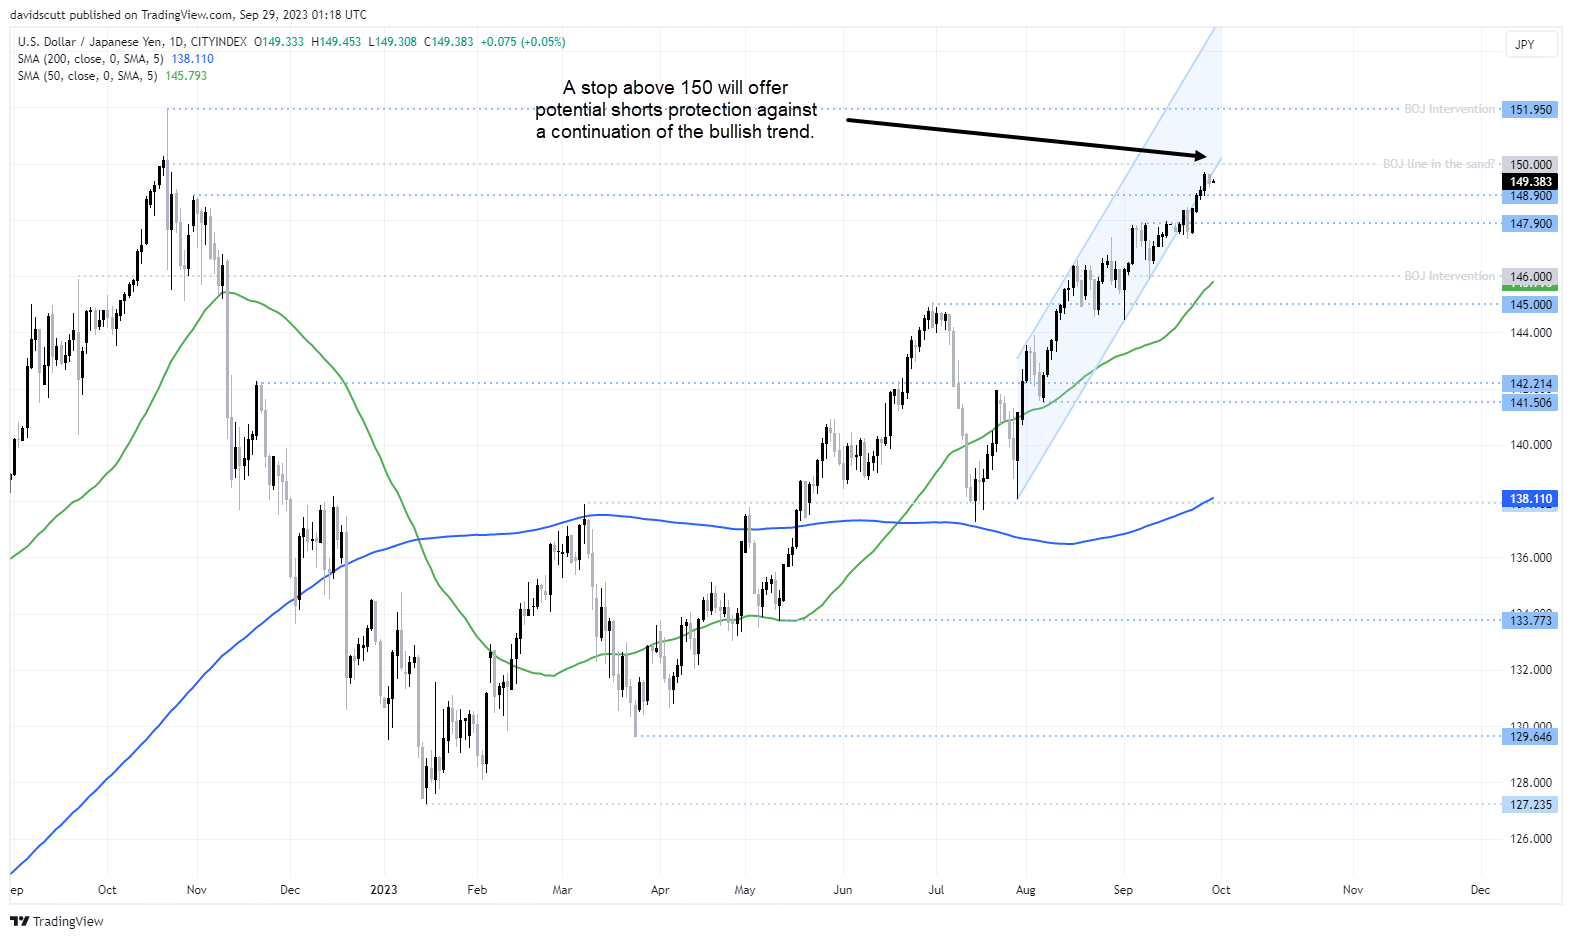
For USD/JPY, 150 is widely regarded as a possible level in which the BOJ may intervene to support the yen, making it a decent location to place a stop-loss above on the initiation of a short position. 148.90, 147.90, 146.00 and 145.00 are the first downside targets to consider.
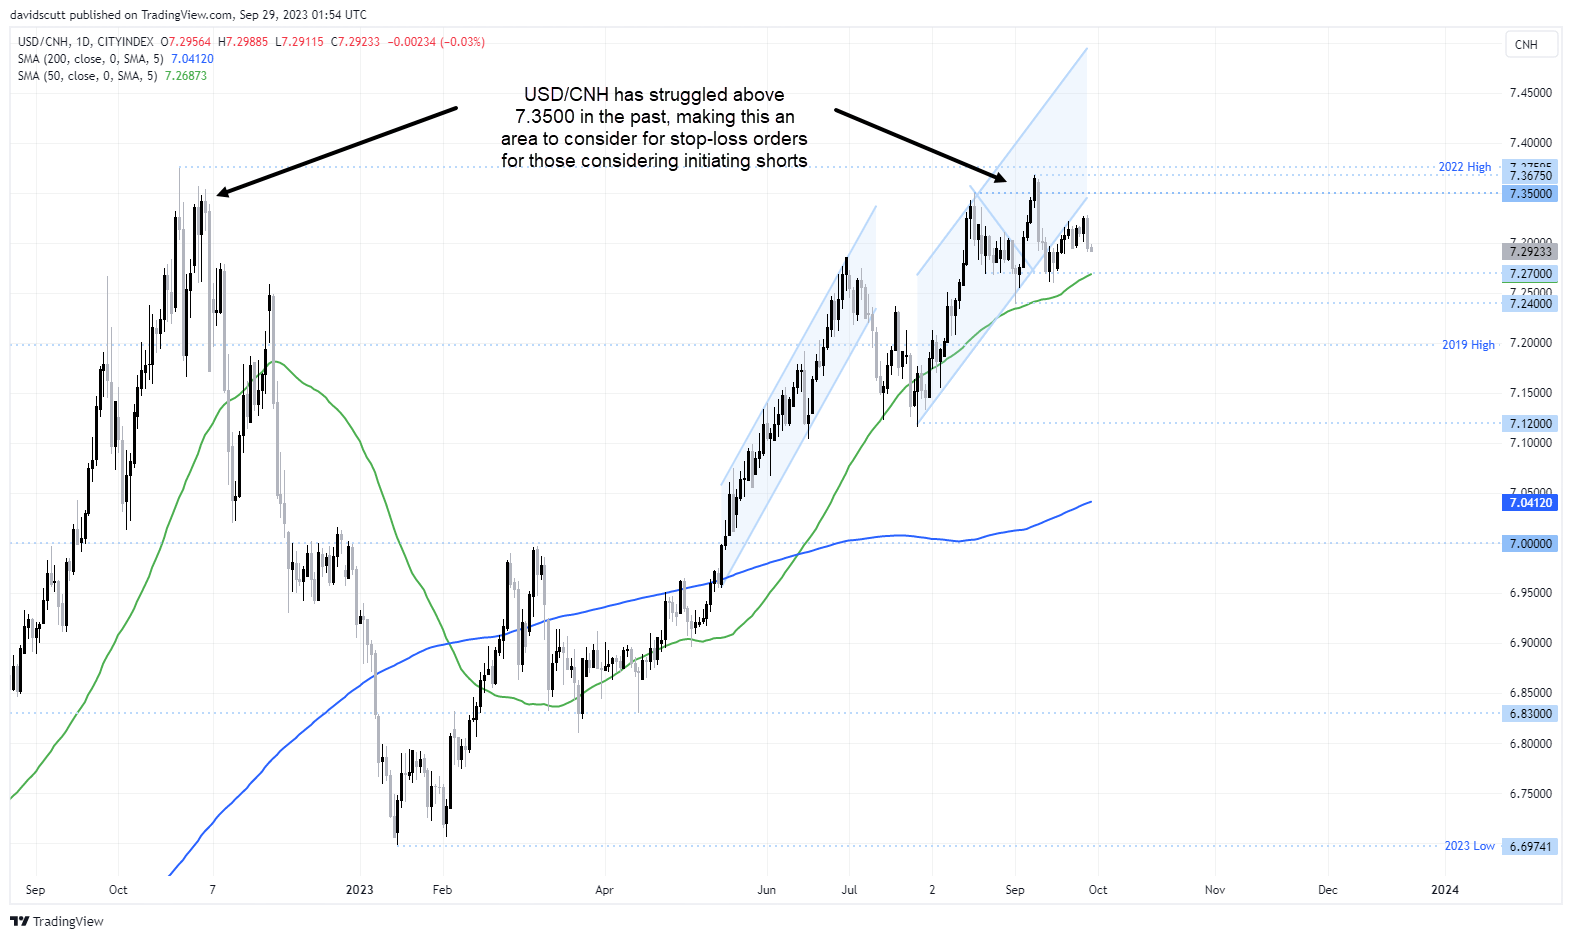
As for USD/CNH, those considering shorts could place stops above 7.3500, a level in which the pair has struggled to overcome over recent years. Downside targets include 7.2700, 7.2400, 7.1200 with a more significance support level found at the big figure of 7.
-- Written by David Scutt
Follow David on Twitter @scutty
How to trade with City Index
You can trade with City Index by following these four easy steps:
-
Open an account, or log in if you’re already a customer
• Open an account in the UK
• Open an account in Australia
• Open an account in Singapore
- Search for the market you want to trade in our award-winning platform
- Choose your position and size, and your stop and limit levels
- Place the trade
Latest market news
Yesterday 01:32 PM
Yesterday 09:35 AM
Yesterday 07:23 AM
Yesterday 04:48 AM
Yesterday 12:17 AM
July 25, 2024 10:39 PM
Latest USD/JPY articles

Yesterday 07:23 AM

July 25, 2024 10:39 PM

July 25, 2024 08:50 AM

July 25, 2024 04:37 AM