April 11, 2022 8:03 PM

The Bank of Canada meets on Wednesday to decide how much it should raise interest rates. When the central bank last met on March 2nd, it hiked interest rates by 25bps to 0.5%. This was the first time the BOC hiked rates since October 2018. At the time, the BOC also decided to maintain the current size of its balance sheet by reinvesting the proceeds of its government bonds until it deemed appropriate. Since then, Canada released its February CPI data. The print was 5.7% YoY vs 5.5% YoY expected and 5.1% YoY last. In addition, Canada also released its February and March Employment Change. The results were +336,600 and +72,500, respectively. With strong inflation and strong employment data, the BOC is sure to begin tapering its bond holdings. The only question for the central bank is “How much should they hike?”. Most are expected a hike of 50bps; however, some are hoping that it may hike as much as 75bps!
Everything you wanted to know about the Bank of Canada
USD/CAD has been trading in a range since November 10th between 1.2454 and 1.2900. However, on April 5th, the pair tested the bottom of the range and failed, leaving a hammer candlestick on the daily timeframe. Hammers are reversal signals. The pair hasn’t looked back since and has formed a bullish engulfing candle today! In addition, USD/CAD traded above horizontal resistance, and upward sloping trendline dating to June 1st, 2021, and the 200 Day Moving Average, near 1.2620.
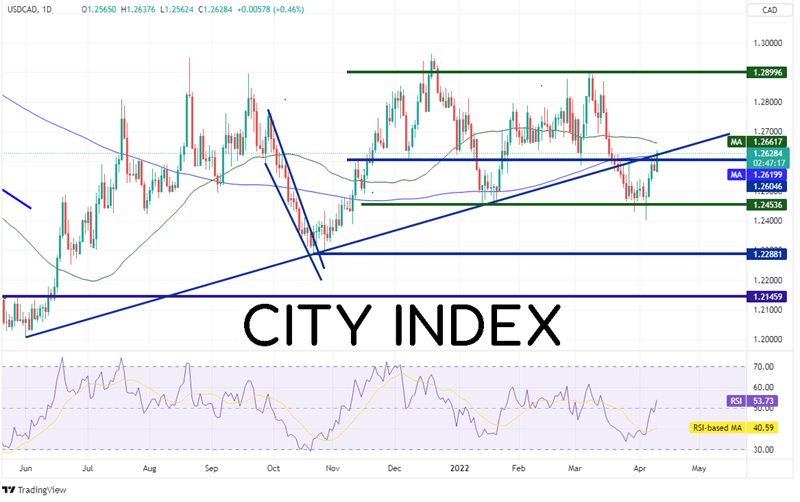
Source: Tradingview, Stone X
Trade USD/CAD now: Login or Open a new account!
• Open an account in the UK
• Open an account in Australia
• Open an account in Singapore
On a 240-minute timeframe, USD/CAD has retraced to the 50% level from the highs of March 15th to the lows of April 5th. First resistance is 50 Day Moving Average at 1.2660 (see daily), then the 61.8% Fibonacci retracement level from the March 15th high to the April 5th lows near 1.2692. Above there, price can trade to horizontal resistance at 1.2781. However, notice the RSI has moved into overbought territory, an indication price may be ready for a pullback. First support below the 200-Day Moving Average is horizontal support at 1.2540. Below there, price can drop to the April 5th lows near 1.2402.
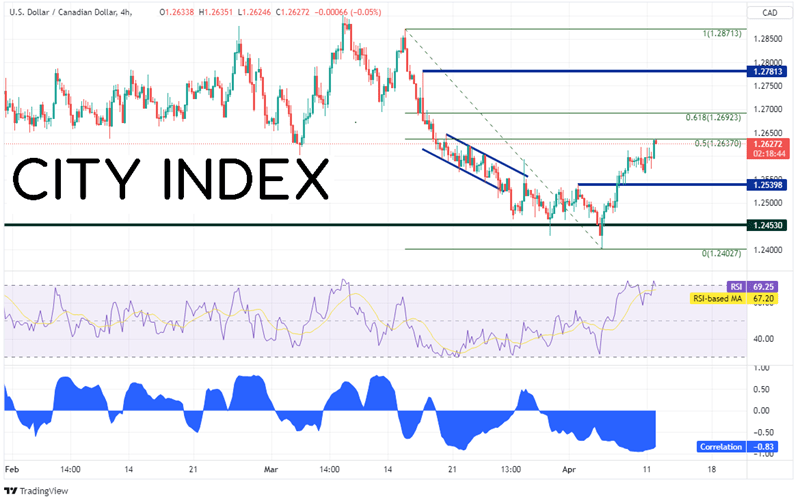
Source: Tradingview, Stone X
Notice as well that USD/CAD and WTI Crude Oil have become highly negatively correlated once again with a correlation coefficient of -0.83. Any reading below -0.80 is considered a strong, negative correlation. (With Crude being so volatile over the last month, the correlation had fallen out of favor). Therefore, if one is looking for direction for USD/CAD, WTI Crude Oil may offer some help.
The Bank of Canada meets on Wednesday and is expected to hike interest rates. In addition, it is expected to begin to unwind its balance sheet. However, the markets will be waiting to see if the BOC hikes by 50bps or by 75bps.
Learn more about forex trading opportunities.
Latest market news
Yesterday 01:32 PM
Yesterday 09:35 AM
Yesterday 07:23 AM
Yesterday 04:48 AM
Yesterday 12:17 AM
July 25, 2024 10:39 PM
Latest Trade Ideas articles

Yesterday 09:35 AM

Yesterday 12:17 AM

July 25, 2024 10:39 PM

July 25, 2024 05:30 PM