

View related analysis:
Bitcoin falters at $70k yet again, volatility could be set to remain
Bitcoin bulls eye record highs - but we could see some ‘chop at the top’
At the beginning of March and again this Wednesday, I outlined that tendency for Bitcoin to revert to volatile and choppy conditions each time it failed to hold above $70k. We saw two market tops and subsequent bear markets in 2021 following a false break of $70k, and the question now is whether history will repeat with a significant move lower.

Of course, volatility cuts both ways. So even if Bitcoin does enter a bear market (defined by a 20% fall from its cycle high), that is not to say it will happen in a straight line. And that provide opportunities for bulls and bears, but the key point I am making is that the parabolic bullish phase appears to be over.
The bias on Wednesday was for Bitcoin futures prices to bounce above $60k, and so far that has played out. Yet prices are now trapped between $60k and a series of historical all-time highs (weekly and monthly close), and prices do seem to be interacting with them to show their significance. So today is a quick follow u0p to look at intraday price action and hopefully identify a near-term opportunity.
Bitcoin futures technical analysis (daily chart):
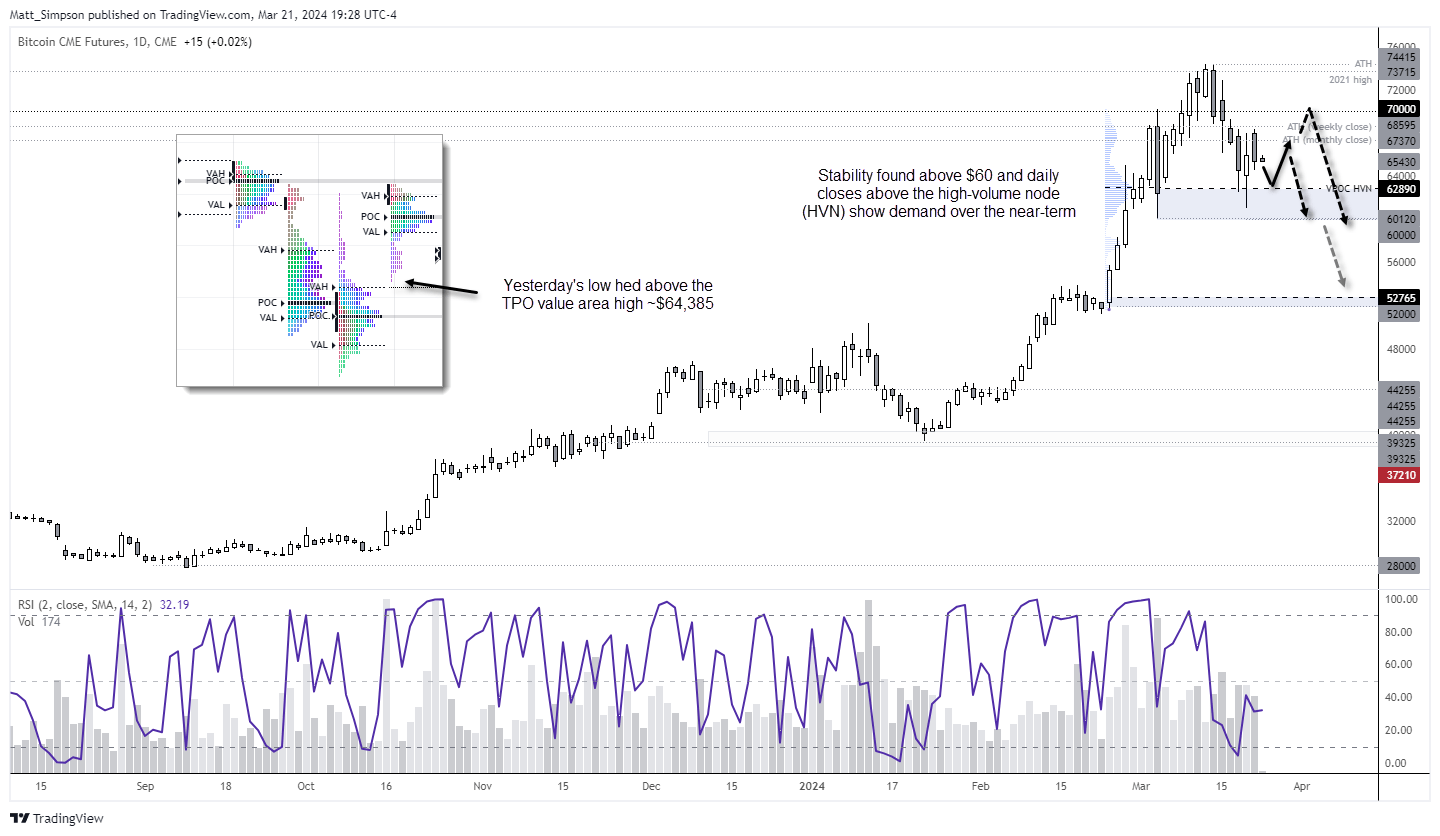
The daily chart shows that Bitcoin futures did indeed bounce in line with the near-term bullish bias, a day after RSI (2) had reached oversold. Support was found above $60k and the daily chart closed above the $62,890 high-volume node, which suggests demand around that level. Therefore any pullbacks towards $63k may be favourable for bulls to seek dips.
Yet as the weekly RSI (2) remains below 50 but above the oversold zone, the bias remains for further losses on the weekly chart once the correction higher on the daily chart has played out.
Bitcoin futures technical analysis (1-hour chart):
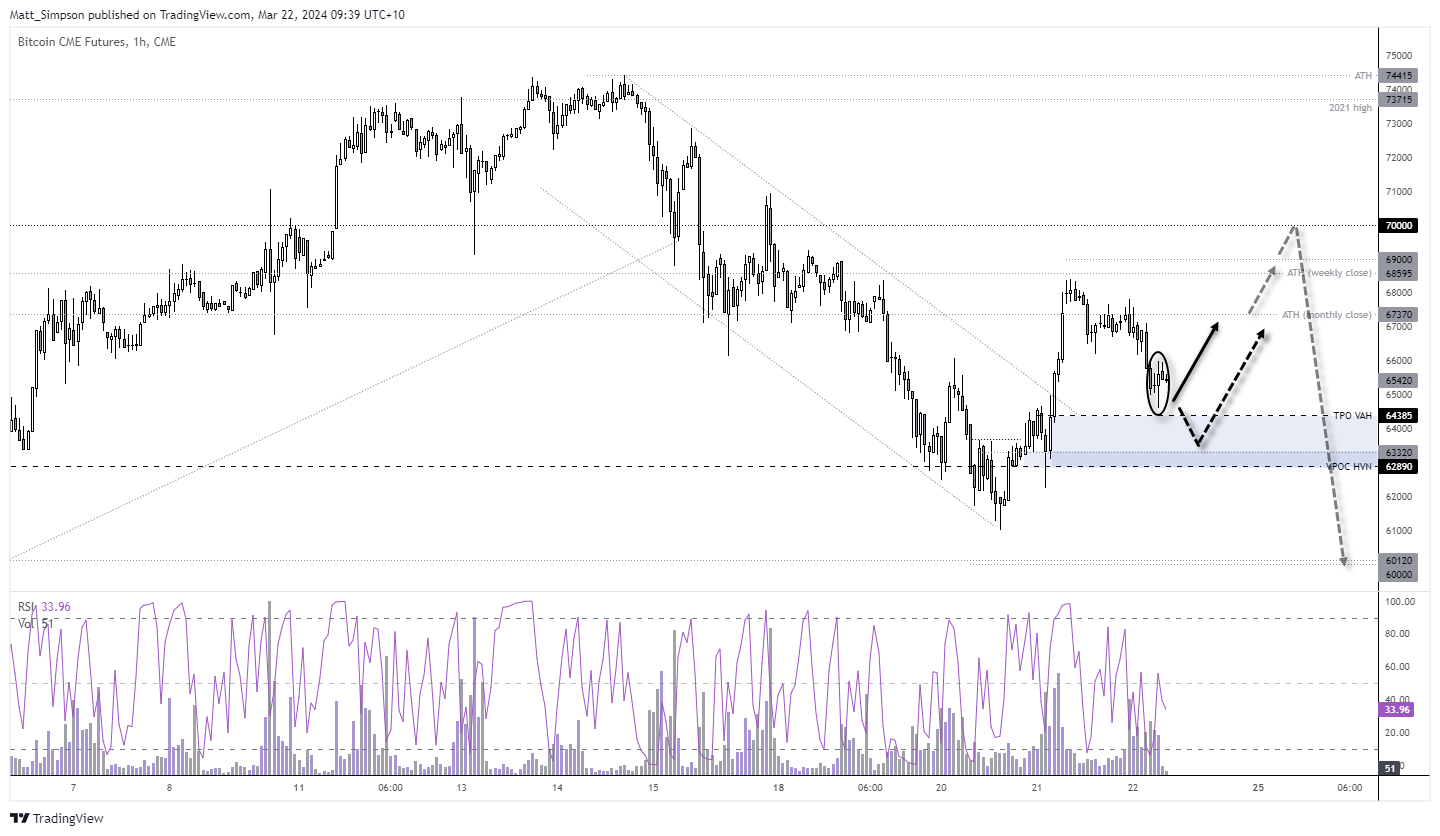
The 1-hour chart shows a clear acceleration from the $63k area (a high-volume node). Prices are now retracing against that move as they presumably fill the liquidity pockets left by the strong rally. But perhaps we are at or near a bullish inflection point for this timeframe. The RSI (2) reached oversold and a bullish engulfing / outside candle formed above the TPO VAH.
- Bulls could seek dips above $64,400 with $67k as a target, a break above which brings $69k and $70k into focus
- If prices continue lower, the next area of support for dip buyers to consider is the $63k area, near the HVN
-- Written by Matt Simpson
Follow Matt on Twitter @cLeverEdge
How to trade with City Index
You can trade with City Index by following these four easy steps:
-
Open an account, or log in if you’re already a customer
• Open an account in the UK
• Open an account in Australia
• Open an account in Singapore
- Search for the market you want to trade in our award-winning platform
- Choose your position and size, and your stop and limit levels
- Place the trade
Latest market news
Yesterday 01:32 PM
Yesterday 09:35 AM
Yesterday 07:23 AM
Yesterday 04:48 AM
Yesterday 12:17 AM
July 25, 2024 10:39 PM
Latest Trade Ideas articles

Yesterday 09:35 AM

Yesterday 12:17 AM

July 25, 2024 10:39 PM

July 25, 2024 05:30 PM