

I warned on March 5th:
“The parabolic nature of Bitcoin is best seen on the weekly chart, and the current rally is likely more comparable to the runup seen in the first half of 2021. And if this rally is to play out in a similar fashion, it suggests volatility over the coming weeks could follow before prices fall”.
Bitcoin technical analysis (monthly chart):
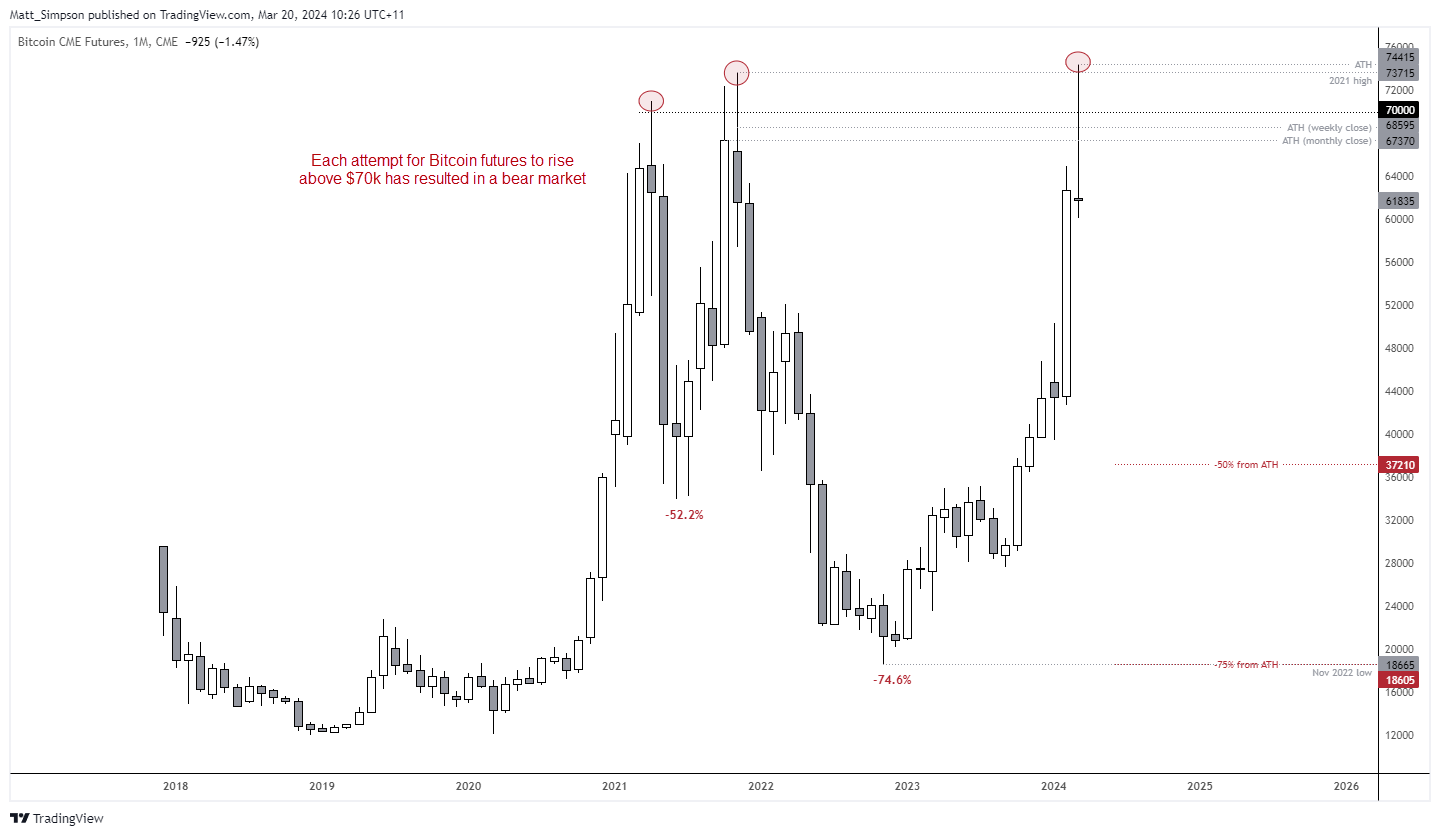
The month is yet to close, but Bitcoin futures are on track for an elongated bearish pinbar on the monthly chart around current levels. And when compared to February’s prominent bullish candle, it is easy to see the ‘change of character’ on Bitcoin prices. And that this tends to be the case when Bitcoin reaches such levels, as we’re yet to see a sustained breakout above 70k – as each time it has tried to hold above $70k, a bear market has ensued.
Even if prices rise from here into month end, what stands out is the failed attempt to break above the 2021 high and swift bearish reversal back beneath the weekly and monthly-close ATHs. And we have seen this record play before.
False breaks above $70k
- April 2021, resulted in a -52.2% decline over two months
- November 2021, resulted in a -74.6% decline over 12 months

I honestly have no idea whether we’re simply seeing a retracement before its next leg higher, or if this will be the third time a failed break above $70k results in a 50-75% bear market. But what I do suspect we’re witnessing is the beginning of a choppy phase, and that could mean large losses or win in either direction for bulls and bears over the coming weeks or even months.
Bitcoin technical analysis (weekly chart):
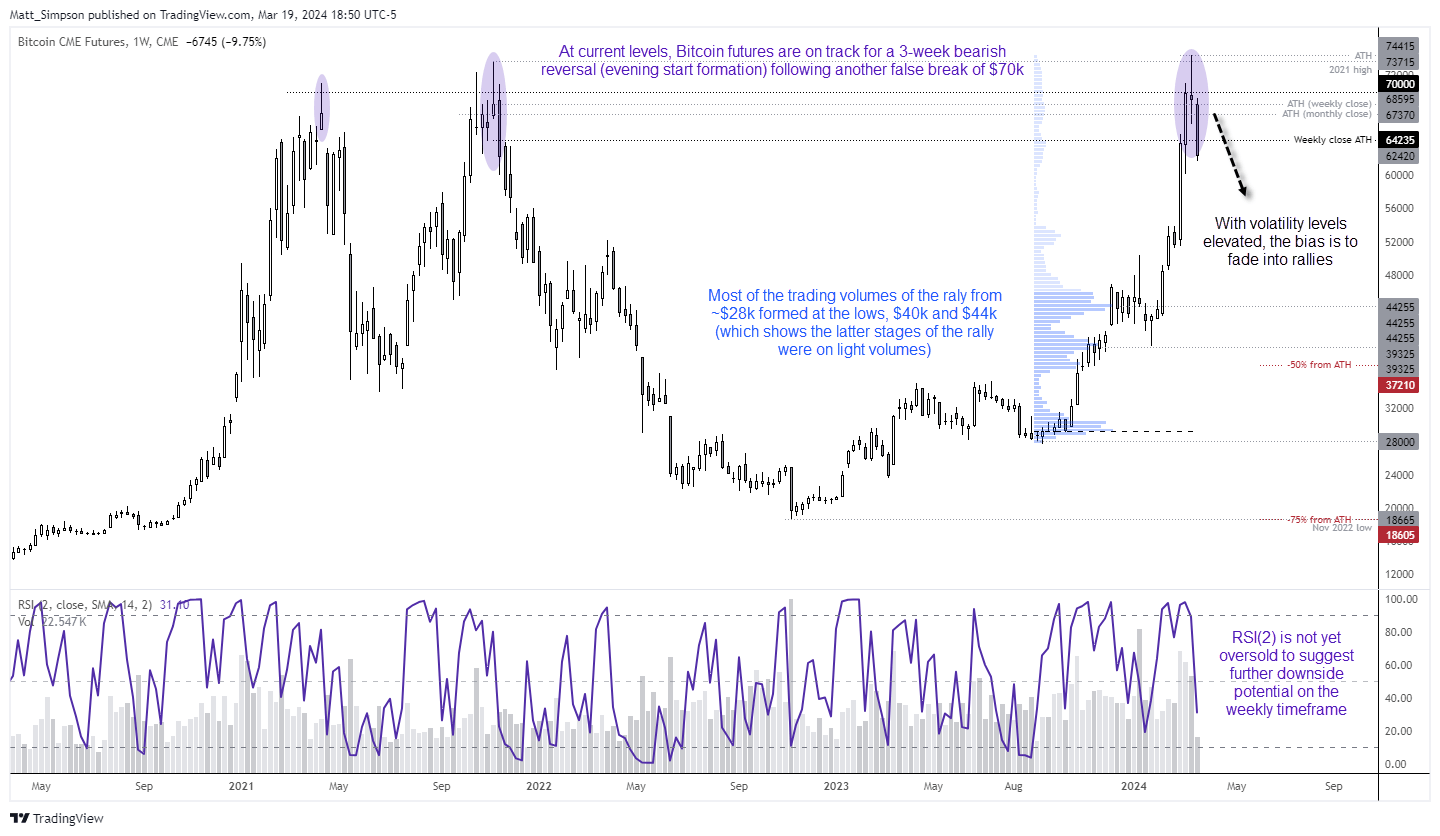
The weekly futures chart produced a spinning top doji last week, alongside a false break of the infamous $70k threshold. This has been followed by bearish range expansion this week, so at current levels Bitcoin futures are on track for a 3-bar bearish reversal (evening star formation) – not too dissimilar to the 2021 top.
RSI (2) is below 50 to show bearish momentum, although yet to move into the oversold zone (below 10) to suggest further downside could await on this timeframe. However, the daily chart shows the potential for a bounce, at least over the near-term.
Something to ‘bear’ in mind is that much of the trading volumes of the rally from $28k were at the beginning of the move, with high-volume nides around $40k and $44k. This suggests that the later stages of the rally were on relatively lower volumes – and therefore controlled by weaker hands.
Bitcoin technical analysis (daily chart):
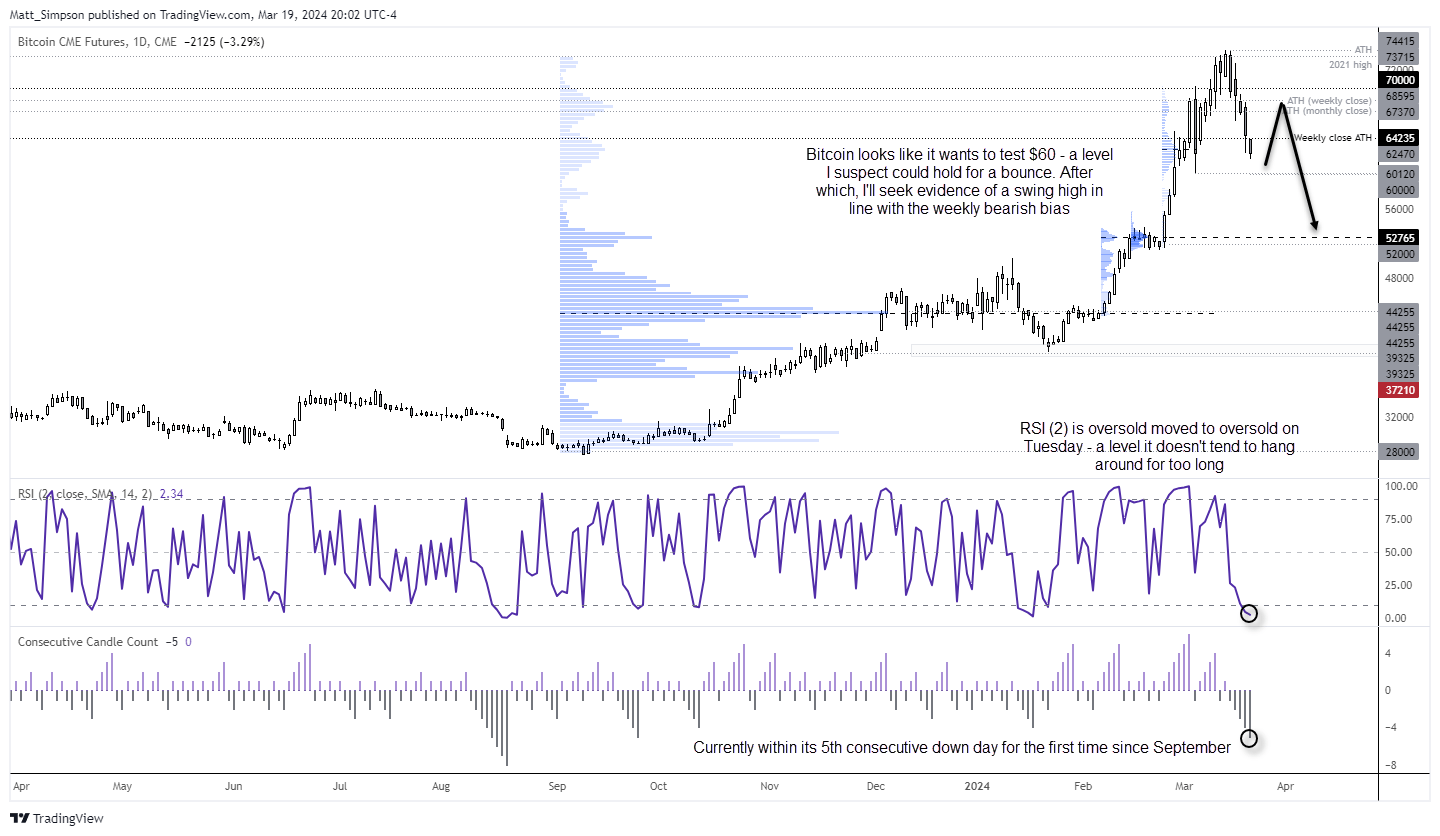
The daily chart shows that Bitcoin is falling for a fifth day, which is a bearish sequence not seen since September. Momentum suggests Bitcoin bears will try to drive this down to $60k over the near-term, but this is a level I suspect will hold. At least initially.
The daily RSI (2) is within oversold for a second day – a threshold it doesn’t tend to stay in for very long. I therefore suspect the closer Bitcoin falls to $60, the greater the odds of a bounce. This could allow bulls to seek dips above this key level with a stop below (and let’s be honest, dip buyers are likely lurking somewhere).
I would then be seeking evidence of a swing high or periods of consolidation around one of the historic ‘ATHs’ to either book potential profits, or seek bearish setups in line with the weekly bearish bias.
A break below $60k could open up the trap doors given the relatively light trading volumes, which brings the high-volume node into focus around $52k.
-- Written by Matt Simpson
Follow Matt on Twitter @cLeverEdge
How to trade with City Index
You can trade with City Index by following these four easy steps:
-
Open an account, or log in if you’re already a customer
• Open an account in the UK
• Open an account in Australia
• Open an account in Singapore
- Search for the market you want to trade in our award-winning platform
- Choose your position and size, and your stop and limit levels
- Place the trade
Latest market news
Yesterday 01:32 PM
Yesterday 09:35 AM
Yesterday 07:23 AM
Yesterday 04:48 AM
Yesterday 12:17 AM
July 25, 2024 10:39 PM
Latest Trade Ideas articles

Yesterday 09:35 AM

Yesterday 12:17 AM

July 25, 2024 10:39 PM

July 25, 2024 05:30 PM