December 21, 2022 7:33 PM

This has been an interesting year for AUD/NZD. If one had bought the currency pair on the first trading day of 2022 and held it until today, that trader would be close to unchanged on year (thru December 21st). Despite interest rate increases by both the Reserve Bank of Australia and the Reserve Bank of New Zealand, the pair rallied roughly 875 pips by September 28th. However, since then, AUD/NZD has given it all back. So, what now?
The high of the year wasn’t an accident. On a monthly timeframe, AUD/NZD made a high of 1.3792 during March 2011. During March of 2020, when the Covid pandemic broke out, the pair made a low of 0.9996. However, the pair bounced and retraced to the 38.2% Fibonacci retracement level from the March 2011 highs to the March 2020 lows near 1.1490. Also notice that the RSI had just moved into overbought territory as the 38.2% Fibonacci retracement level was reached. Since then, the pair has been moving aggressively lower.
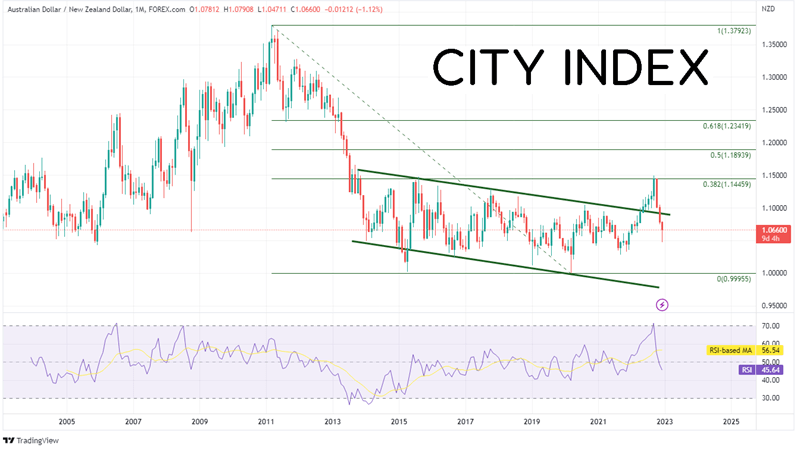
Source: Tradingview, Stone X
Trade AUD/NZD now: Login or Open a new account!
• Open an account in the UK
• Open an account in Australia
• Open an account in Singapore
On a daily timeframe, focusing on the near-term low from September 2021 near 1.0280, the pair was continuing its bounce from the March 2020 lows. However, this key inflection point is important to where the price of AUD/NZD is right now. From the low in September 2021, the pair moved higher, eventually forming an ascending wedge. The expectation from ascending wedge is that price will move lower. However, AUD/NZD posted a false breakout first! Once the 38.2% Fibonacci retracement level was pierced on the monthly timeframe, price moved aggressively lower, back into the wedge, and then below it. The expectation for a target for an ascending wedge is at least the beginning of the wedge, near 1.0825. Price hit the target and continued lower. Notice that at the year’s high, the RSI was in overbought territory. As price moved lower, it fell in a steep, but orderly, downwards sloping channel. Price held support at the trendline dating to the lows from September 2021, as well as the (less often watched) 78.6% Fibonacci retracement level from the lows of September 2021 to the highs on September 28th, 2022.
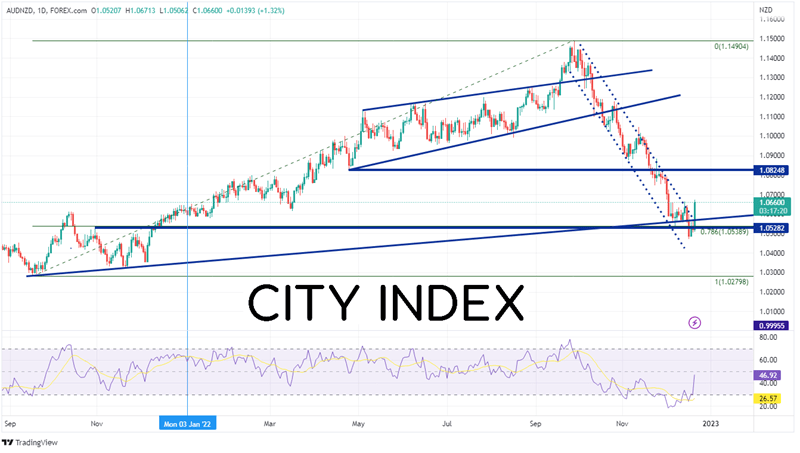
Source, Tradingview, Stone X
On a 240-minute timeframe, AUD/NZD has broken out above the top trendline of the downward sloping channel and has halted as previous resistance near 1.0672. If the pair breaks above, there is additional resistance (previous support) at the lows of April 25th near 1.0825, then the 38.2% Fibonacci retracement level from the highs of September 28th to the lows of December 16th, at 1.0861. However, notice on the shorter timeframe that the RSI has just moved into overbought territory, indicating that the pair may be ready for a pullback. First support is the longer-term upwards sloping trendline off the September 2021 lows near 1.0566, then the December 16th lows at 1.0471. Below there, price can fall to the lows of November 19th, 2021 at 1.0326.
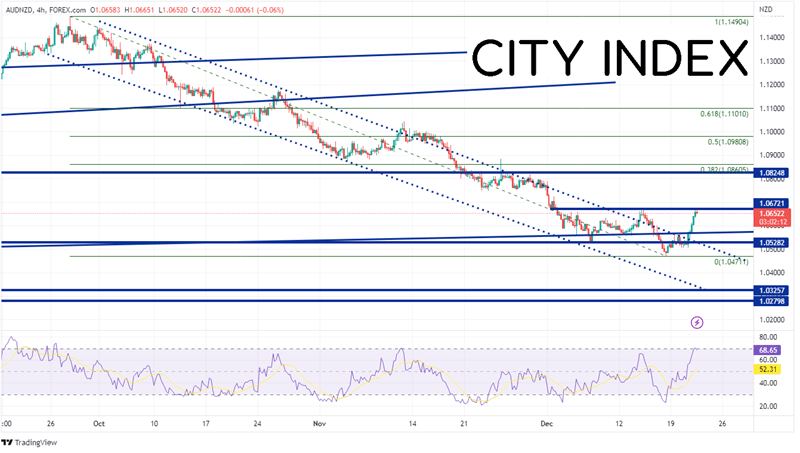
Source, Tradingview, Stone X
AUD/NZD has broken out of the downward sloping channel that the pair has been in since the end of September. Will this be the change in trend that will propel the pair towards the 2022 highs? Or is this a false breakout in the downtrend? We’ll need to wait for more evidence than just one day of volatility to determine the next direction. But as long as AUD/NZD is below 1.0860 (the 38.2% Fibonacci retracement on the 240-minute timeframe), the bounce is shallow. Manage risk accordingly.
Learn more about forex trading opportunities.
Latest market news
Yesterday 01:32 PM
Yesterday 09:35 AM
Yesterday 07:23 AM
Yesterday 04:48 AM
Yesterday 12:17 AM
July 25, 2024 10:39 PM
Latest Trade Ideas articles

Yesterday 09:35 AM

Yesterday 12:17 AM

July 25, 2024 10:39 PM

July 25, 2024 05:30 PM