

At 4.1% y/y, CPI is still over 1% from the RBA’s 1-3% target band, but it is a lot closer than Q4’s 5.4% print. And a quick glance at the economic calendar shows that Q4 inflation figures were broadly below expectations, which will be music to the ears of those calling for RBA cuts. With the RBA’s cash rate futures fully pricing a September cut ahead of the report, bets of a June or August cut are now on the rise.
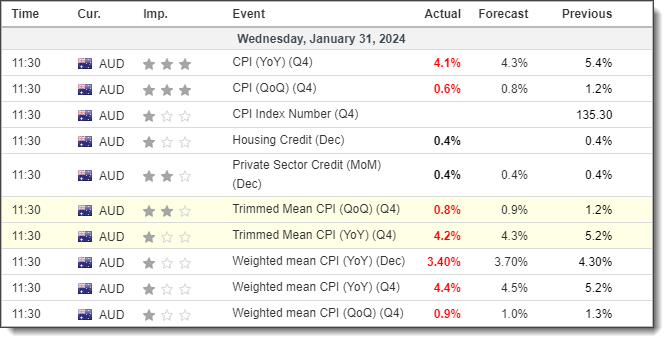
This has been a net positive for the ASX 200 which probed its record high following the CPI figures. And were it not for the pending FOMC meeting, perhaps it could have broken higher. But for the rally to break and hold above its prior record high, we may need a surprisingly dovish FOMC meeting. And as I continue to suspect the Fed will disappoint doves, a pullback from Wall Street and therefore the ASX remains a possibility.
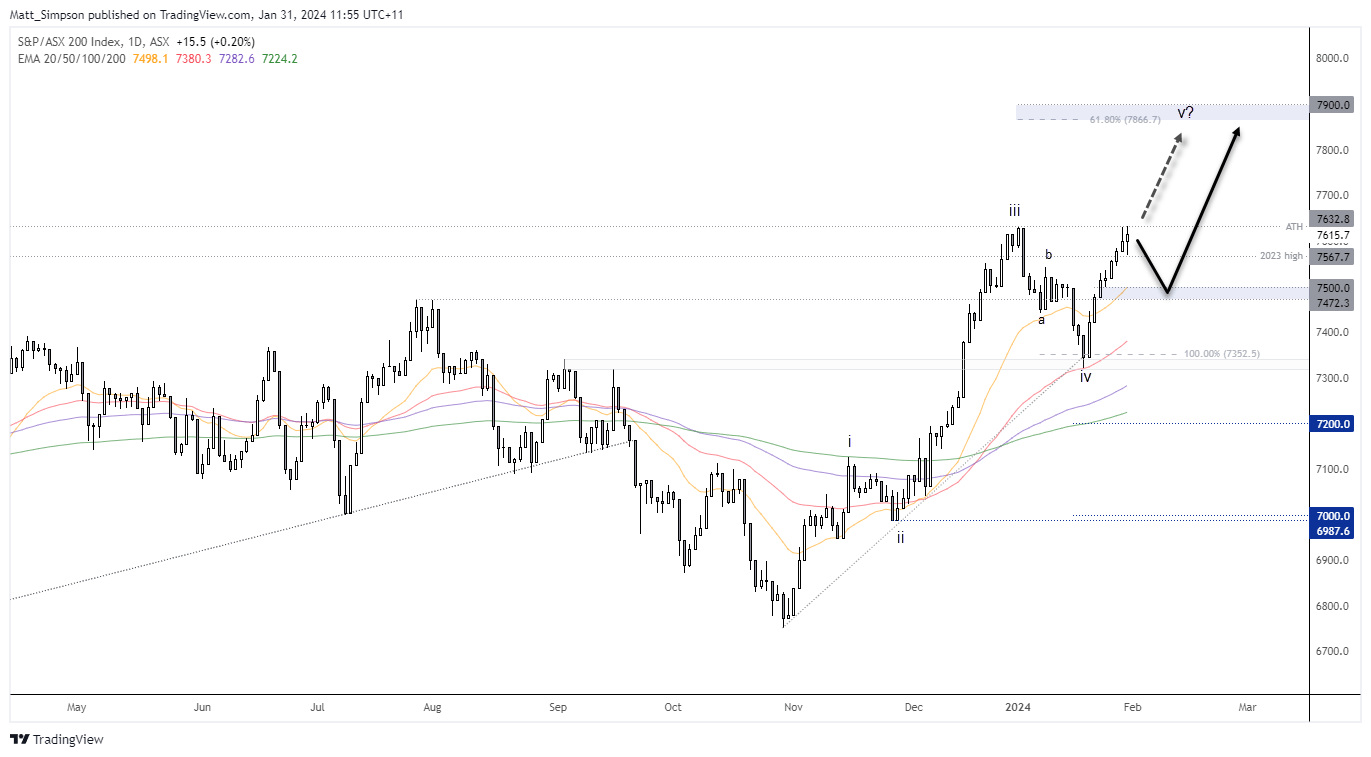
ASX 200 technical analysis (daily chart):
The ASX 200 daily chart appears to be in wave 5 of an impulsive move higher which implies fresh highs are to come, with a 61.8% Fibonacci projection hinting at a rally towards 7900. Should prices retrace first, I would look for the 7500 area to hold as support and seek evidence of a swing low.
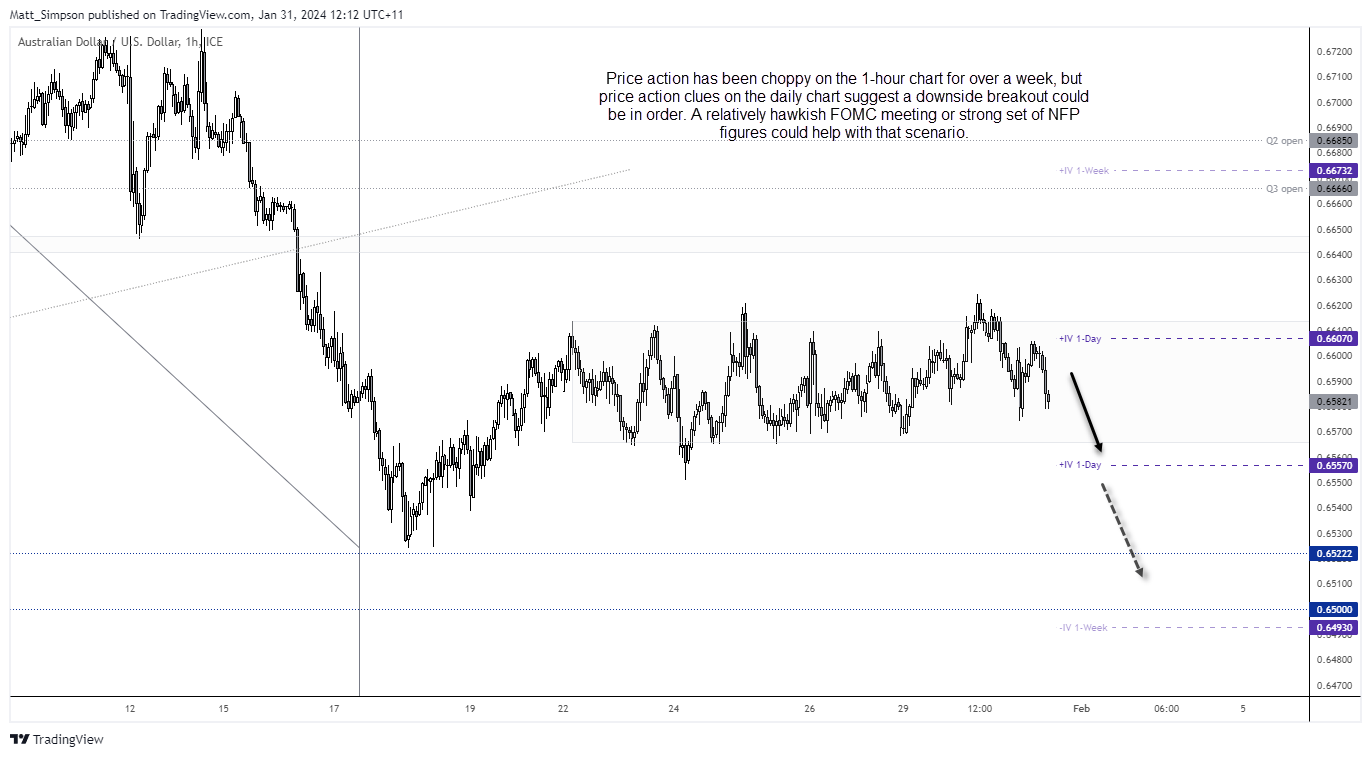
AUD/USD technical analysis (1-hour chart):
Prices have fallen towards Tuesday’s lows, which means the bearish flag on the daily chart remains a potential breakout pattern to monitor. Yet the 1-hour chart shows just how choppy trading conditions have been for the past week, with breakouts turning into fakeouts and prices reverting to back within range.

For bears to stand any chance of a sustained downside break, a relatively hawkish FOMC meeting is likely required. The 1-day implied volatility bands are surprisingly small for the ‘Fed day’, which shows options traders are not overly concerned about price spikes. However, the 1-week plied volatility band suggests AUD/USD could close anywhere between 0.6493 – 0.6607.
From here, the bias remains bearish beneath the daily high and for a downside break of its range. A break beneath the 0.6650 low brings 0.650 into focus.
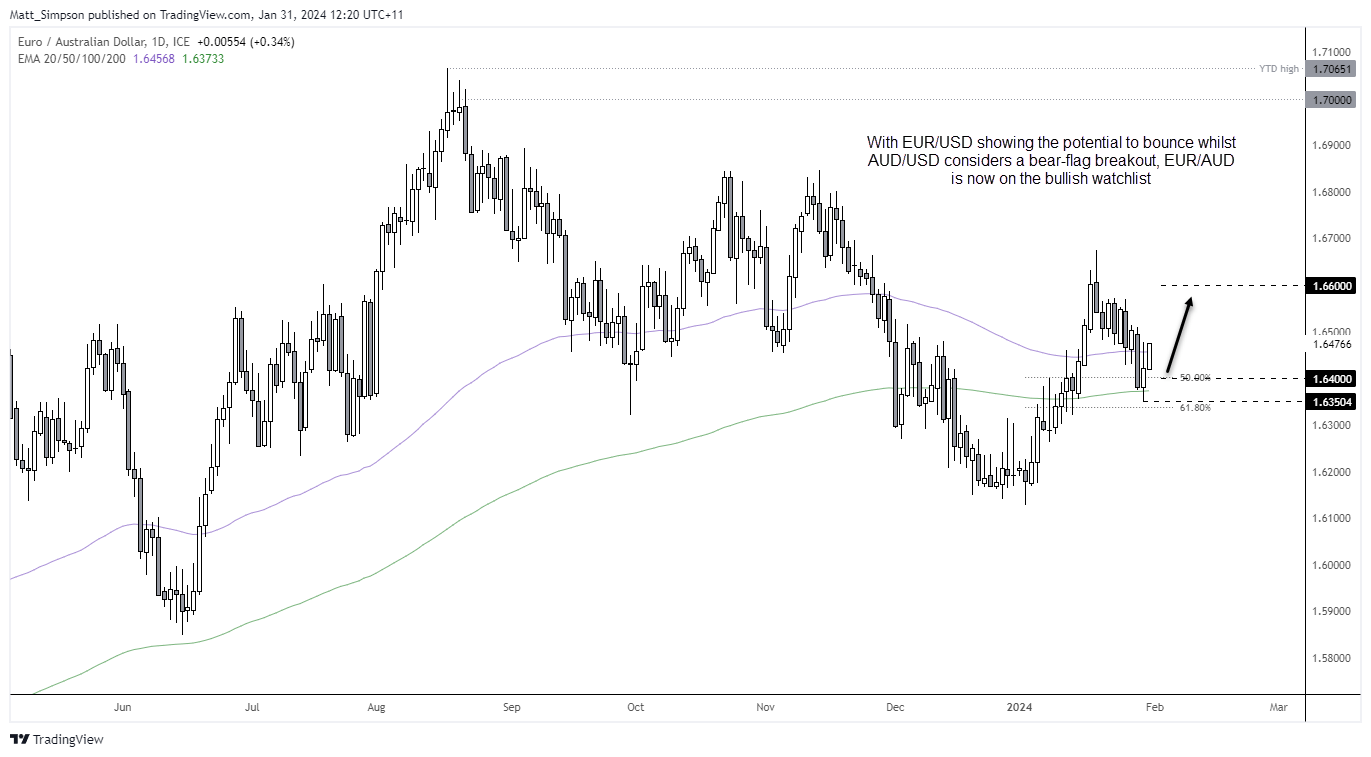
EUR/AUD technical analysis (daily chart):
In yesterday’s US dollar article I mentioned a scenario where EUR/USD could potentially bounce further form its 200-day EMA yet AUD/USD could break lower from its daily bear flag. This would translate to a bullish EUR/AUD setup on the daily chart.
And so far, so good. EUR/AUD found support at its 200-day EMA and is now testing Monday’s high. Perhaps we’ll see prices retreat back within yesterday’s range given the pending FOMC meeting, and that could allow bulls to better position themselves for an anticipated leg higher.
The bias remains bullish above this week’s low and for a move to 1.66.
-- Written by Matt Simpson
Follow Matt on Twitter @cLeverEdge
How to trade with City Index
You can trade with City Index by following these four easy steps:
-
Open an account, or log in if you’re already a customer
• Open an account in the UK
• Open an account in Australia
• Open an account in Singapore
- Search for the market you want to trade in our award-winning platform
- Choose your position and size, and your stop and limit levels
- Place the trade
Latest market news
Yesterday 01:32 PM
Yesterday 09:35 AM
Yesterday 07:23 AM
Yesterday 04:48 AM
Yesterday 12:17 AM
July 25, 2024 10:39 PM
Latest Trade Ideas articles

Yesterday 09:35 AM

Yesterday 12:17 AM

July 25, 2024 10:39 PM

July 25, 2024 05:30 PM