

Asian Futures:
- Australia's ASX 200 futures are down -40 points (-0.54%), the cash market is currently estimated to open at 7,408.70
- Japan's Nikkei 225 futures are down -300 points (-1.03%), the cash market is currently estimated to open at 28,798.24
- Hong Kong's Hang Seng futures are down -5 points (-0.02%), the cash market is currently estimated to open at 25,623.74
- China's A50 Index futures are down -78 points (-0.49%), the cash market is currently estimated to open at 15,780.31
UK and Europe:
- UK's FTSE 100 index fell -24.35 points (-0.33%) to close at 7,253.27
- Europe'sEuro STOXX 50 index fell -3.09 points (-0.07%) to close at 4,220.88
- Germany's DAX index fell -51.25 points (-0.33%) to close at 15,705.81
- France's CAC 40 index fell -12.99 points (-0.19%) to close at 6,753.52
Wednesday US Close:
- The Dow Jones Industrial fell -266.19 points (-0.74%) to close at 35,490.69
- The S&P 500 index fell -23.11 points (-0.51%) to close at 4,551.68
- The Nasdaq 100 index rose 38.906 points (0.25%) to close at 15,598.39
Indices:
Strong quarterly results for Microsoft and Alphabet helped the Nasdaq 100 scratch a 0.25% gain the day, and perhaps it could have been more were it not for lower oil prices and the sell-off with the broader equity market. The Dow Jones and S&P 500 fell -0.74% and -0.51% respectively, both of which breaking beneath Tuesday’s low to confirm their bearish hammers at their all-time highs.
US bond yields were lower as investors weighed up the latest spat between US and China. The FCC (Federal Communications Commission) in the US voted to ban China’s Telecom Corp to operate in the US, with Chinese media speculating that other Chinese firms could be delisted from US exchanges within a year. The US 10-year yields 1.54, down four a fourth day from the 1.705 high.
Futures markets are pointing lower for major benchmarks with the ASX 200 currently expected top open around -0.5% lower. The cash index has struggled to break above Monday’s high and since left two potential reversal candles. However, bears likely need to break trend support from the 6th October low to regain control.
ASX 200 Market Internals:
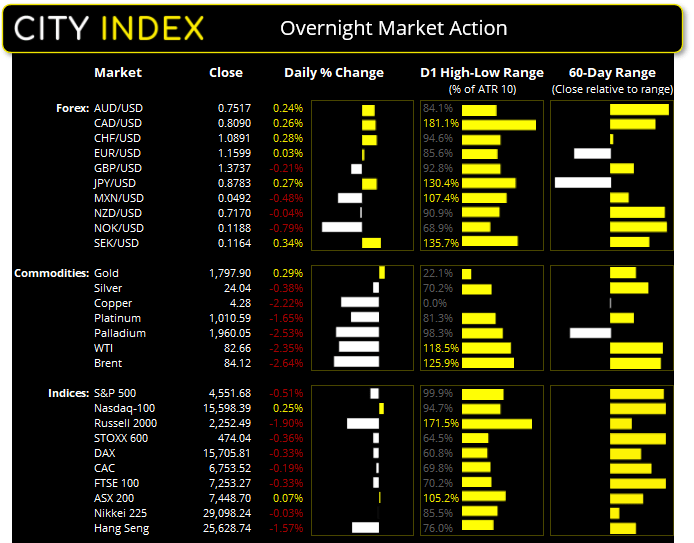
ASX 200: 7448.7 (0.07%), 27 October 2021
- Telecomm Services (1.94%) was the strongest sector and Consumer Staples (-1.98%) was the weakest
- 6 out of the 11 sectors closed higher
- 5 out of the 11 sectors closed lower
- 82 (41.00%) stocks advanced, 106 (53.00%) stocks declined
- 70.5% of stocks closed above their 200-day average
- 55.5% of stocks closed above their 50-day average
- 63% of stocks closed above their 20-day average
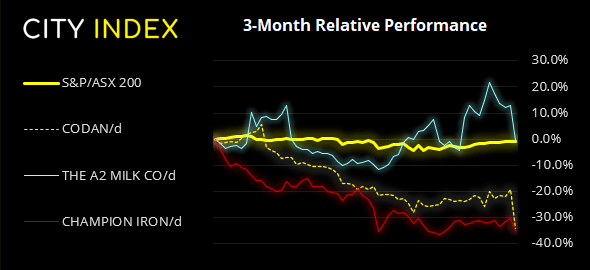
Outperformers:
- + 5.79%-Uniti Group Ltd(UWL.AX)
- + 4.62%-Reliance Worldwide Corporation Ltd(RWC.AX)
- + 4.04%-Whitehaven Coal Ltd(WHC.AX)
Underperformers:
- -18.77%-Codan Ltd(CDA.AX)
- -11.97%-A2 Milk Company Ltd(A2M.AX)
- -6.63%-Champion Iron Ltd(CIA.AX)
Forex:
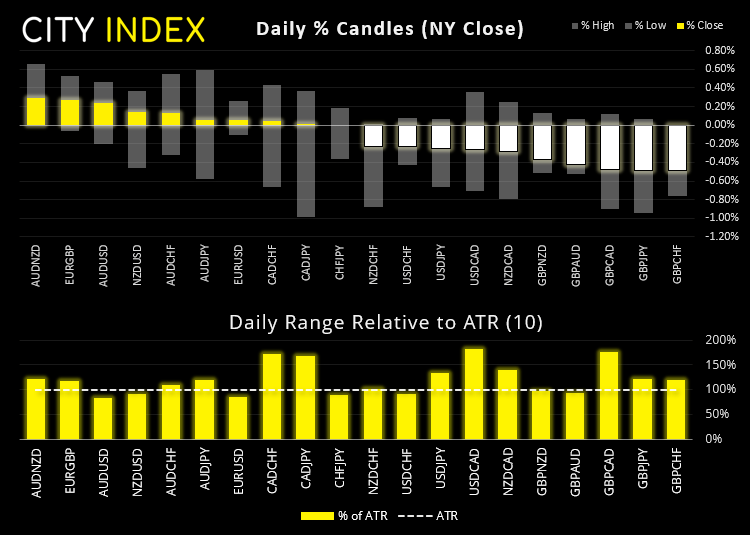
The US dollar index (DXY) failed to hold onto Tuesday’s gains although closed on the 20-day eMA. As the dollar tracked bond yields lower. AUD/USD rose for a third day after a strong CPI report sent bond yields higher and expectations for RBA’s first hike forward, and commodity currencies and yen all closed higher against USD.
The baulk of volatility was seen on CAD crosses after the Bank of Canada exceeded tapering expectations to fully remove bond purchases. They also signalled they could increase interest rates by April, which was sooner than the 2nd half of 2022 markets were positioned for. For AUD/CAD and GBP/CAD, it was the most volatile session in three months, with the latter being the third weakest pair on the day.
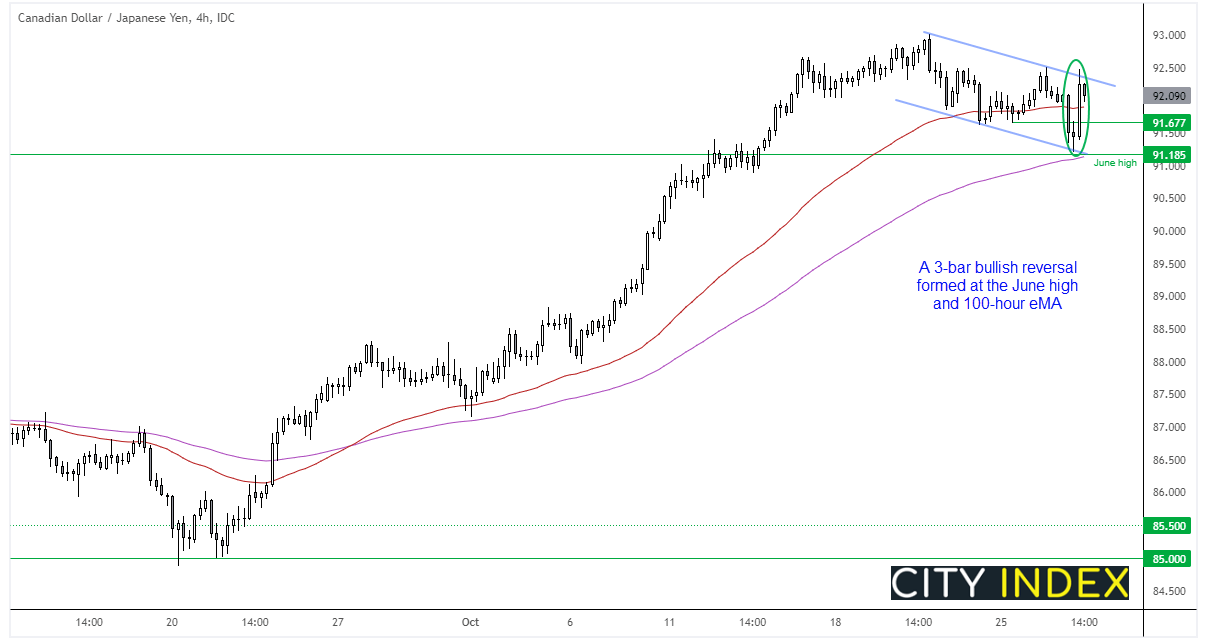
CAD/JPY may have completed a 3-wave correction from its October high. A bullish pinbar formed on the daily chart which found support at the 91.18 June high and 100-hour eMA and closed above its 10-day eMA. The four-hour chart shows an elongated Morning Star Reversal pattern (bullish reversal) and the current four-hour chart has remained in the top quarter of the prior candle. From here we’re now looking for prices to hold above 91.67 and break above 92.50 to confirm a change in trend on the current timeframe.
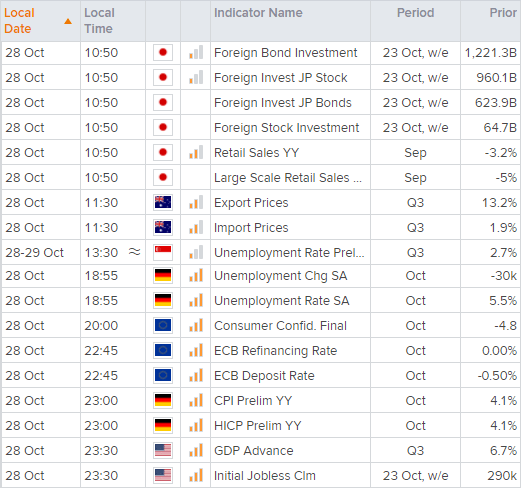
The calendar has light data in today’s Asian session, including foreign and domestic market activity for Japan and trade price data for Australia. German employment data is ahead of today’s main event, ECB’s monetary policy meeting at 22:45 AEDT. US then release advanced GDP for Q3 at 22:30.
Commodities:
It was the most bearish day in nearly 3-months for WTI after US stockpiles rose more than expected, prompting investors to dump longs after several weeks of accumulation from fund managers. WTI twice failed to close above $85 on Monday and Tuesday following its bearish pinbar at the highs and momentum has now turned lower as it enters a corrective phase.
1800 remains the line in the sand on gold. Spot prices saw a daily close just above the 200-day eMA yet below the milestone level. It remains in a bullish channel having built support above 1780, yet current prices could also be part of a lower high as prices coil up. One to watch, whichever way it breaks.
Up Next (Times in AEDT)
How to trade with City Index
You can trade easily trade with City Index by using these four easy steps:
-
Open an account, or log in if you’re already a customer
• Open an account in the UK
• Open an account in Australia
• Open an account in Singapore
- Search for the company you want to trade in our award-winning platform
- Choose your position and size, and your stop and limit levels
- Place the trade
Latest market news
Yesterday 01:32 PM
Yesterday 09:35 AM
Yesterday 07:23 AM
Yesterday 04:48 AM
Yesterday 12:17 AM
July 25, 2024 10:39 PM
Latest Trade Ideas articles

Yesterday 09:35 AM

Yesterday 12:17 AM

July 25, 2024 10:39 PM

July 25, 2024 05:30 PM