

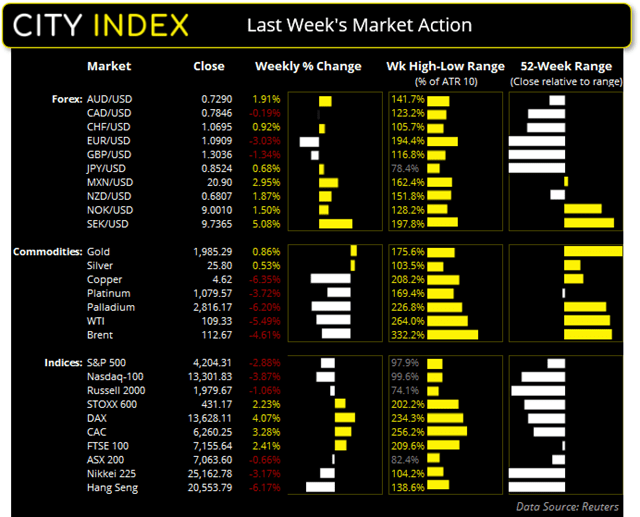
US Friday close:
- The Dow Jones fell -229.91 points (-0.69%) to close at 32,944.19
- The S&P 500 fell -55.21 points (-1.3%) to close at 4,204.31
- The Nasdaq 100 fell -289.165 points (-2.13%) to close at 13,301.83
Asian Indices:
- Australia’s ASX 200 index closed at 7,063.60 on Friday
- Japan's Nikkei 225 index closed at 25,162.78 on Friday
- Hong Kong's Hang Seng index closed at 20,553.79 on Friday
- China'sA50 Index closed at 13,846.46 on Friday
European Friday close:
- UK's FTSE 100 index rose 56.55 points (0.8%) to close at 7155.64
- Europe's Euro STOXX 50 index rose 35.39 points (0.97%) to close at 3686.78
- Germany's DAX index rose 186.01 points (1.38%) to close at 13628.11
- France's CAC 40 index rose 53.05 points (0.85%) to close at 6260.25
Trading conditions remained choppy on Wall Street and its direction investors grappled with repeatedly dashed hopes of a ceasefire in Ukraine, alongside headlines worrisome headlines of chemical warfare which could draw the West into the war.
Ultimately US equity markets fell around two to three percent last week, although volatility has subsided a little with the high to low range of the week below its 10-week eMA. At this stage we continue to expect choppy trading conditions which means investors would be wise to do one of two things; lower holding times to remain nimble, or simply step aside until traditional market drivers take hold once more. Futures markets are yet to open but weekend news that Russia has struck a military airbase on the border of Poland (a NATO member) is unlikely to revive investor confidence today.
ASX 200:
At current levels the ASX 200 is on track for a low-volatility, flat month. And that is a sign of strength given equity performance elsewhere. Last week’s high met resistance at the 50-week eMA and last week’s low failed to hold beneath 7,000. Range-trading strategies may be the best way forward (so to speak) and for traders to remain nimble and not marry their positions until volatility and a directional breakout materialise.
ASX 200: 7063.6 (-0.94%), 11 March 2022
- Energy (0.34%) was the strongest sector and Healthcare (-2.26%) was the weakest
- 3 out of the 11 sectors closed higher
- 8 out of the 11 sectors closed lower
- 4 out of the 11 sectors outperformed the index
- 64 (32.00%) stocks advanced, 121 (60.50%) stocks declined
Outperformers:
- +7.19% - AVZ Minerals Ltd (AVZ.AX)
- +4.96% - Allkem Ltd (AKE.AX)
- +4.58% - Champion Iron Ltd (CIA.AX)
Underperformers:
- -7.62% - Zip Co Ltd (Z1P.AX)
- -6.76% - Magellan Financial Group Ltd (MFG.AX)
- -6.57% - Pro Medicus Ltd (PME.AX)
USD was the strongest major last week
The dollar regained its dominance last week after another red-hot CPI revived expectations of an aggressive rate hike path from the Fed, which is due to begin this week. Previously there had been some scepticism about the coming initial hike due to geopolitical tensions, but Fed members made it clear that would not be the case.
USD/JPY closed above 117 for the first time since January 2017 on Friday, during its most bullish session November 2020. CAD/JPY is also back above 92.0 thanks to an outflow from yen pairs and significantly higher oil prices. AUD/JPY stopped just shy of our 86.0 target and formed a bearish pinbar on Friday, warning of near-term exhaustion to the upside. GBP/USD fell to a 16-month low and trades just 17 pips above 1.30.
NZD/USD looks set for a countertrend phase
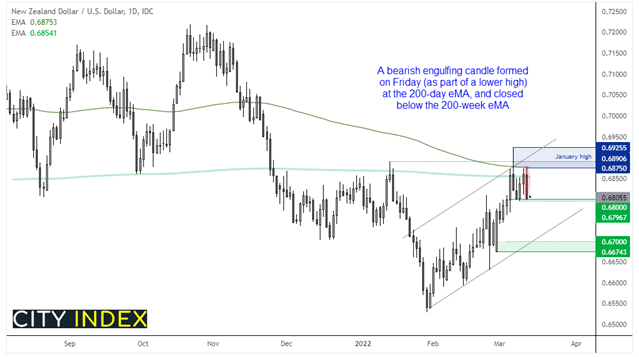
Last Monday the Kiwi dollar rose to a 15-week high as it tracked commodity prices higher. Yet the wobble in oil prices and stronger USD dollar coincided with a reversal at its 200-day eMA, and back below its 200-week eMA. A lower high has formed on the daily chart with a bearish engulfing (and outside day) closing at the 0.6800 support level.
This week our bias remains bullish below the 200-day eMA / Friday’s high and would consider fading into minor rallies, in anticipation of a break below 0.6795.
Gold and silver outshined commodity peers
Whilst gold close higher, it has formed a bearish hammer on the weekly chart which failed to probe its record high by a mere $5. Clearly, it remains supported but there was equal appetite to book profits around the record high. Ultimately, we think it will go on to break that record high but what remains unclear is as to how quickly bulls can regain control. A bullish hammer formed on Friday and a base appears to be forming above 1950, so we’re on guard for a higher low to form ahead of its next leg higher.
Copper and palladium reached record highs yet then handed back those earlier gains just as quickly, with the short-squeeze (and closure of nickel trading) seemingly the trigger for the rise and fall of other metals. Trading conditions appear unfavourable on such markets in either direction, so we prefer to step aside for now.
Despite oil’s best attempt to enter a technical bear market (-20% fall from a cycle high) on Wednesday, support has since been found above 104 on WTI, which is likely to be a pivotal level this week. Yet it runs the risk of seeing choppy trade within last week’s range with lower volatility, a pattern which is usually consistent following such a wild move.
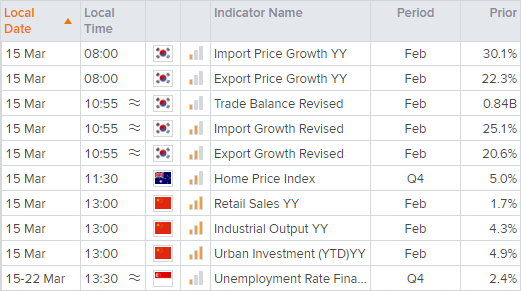
Up Next (Times in AEDT)
How to trade with City Index
You can easily trade with City Index by using these four easy steps:
-
Open an account, or log in if you’re already a customer
• Open an account in the UK
• Open an account in Australia
• Open an account in Singapore
- Search for the company you want to trade in our award-winning platform
- Choose your position and size, and your stop and limit levels
- Place the trade
Latest market news
Yesterday 01:32 PM
Yesterday 09:35 AM
Yesterday 07:23 AM
Yesterday 04:48 AM
Yesterday 12:17 AM
July 25, 2024 10:39 PM
Latest Trade Ideas articles

Yesterday 09:35 AM

Yesterday 12:17 AM

July 25, 2024 10:39 PM

July 25, 2024 05:30 PM