

US Friday close:
- The Dow Jones rose 254.47 points (0.74%) to close at 34,807.46
- The S&P 500 rose 50.43 points (1.14%) to close at 4,511.61
- The Nasdaq 100 rose 278.242 points (1.94%) to close at 14,654.33
Asian Indices:
- Australia’s ASX 200 index closed at 7,341.10 on Friday
- Japan's Nikkei 225 index closed at 27,224.11 on Friday
- Hong Kong's Hang Seng index closed at 21,889.28 on Friday
- China'sA50 Index closed at 13,746.68 on Friday
European Friday close:
- UK's FTSE 100 index rose 34.33 points (0.46%) to close at 7476.72
- Europe's Euro STOXX 50 index rose 44.32 points (1.14%) to close at 3926.12
- Germany's DAX index rose 146.23 points (1.02%) to close at 14473.2
- France's CAC 40 index rose 77.08 points (1.17%) to close at 6659.41
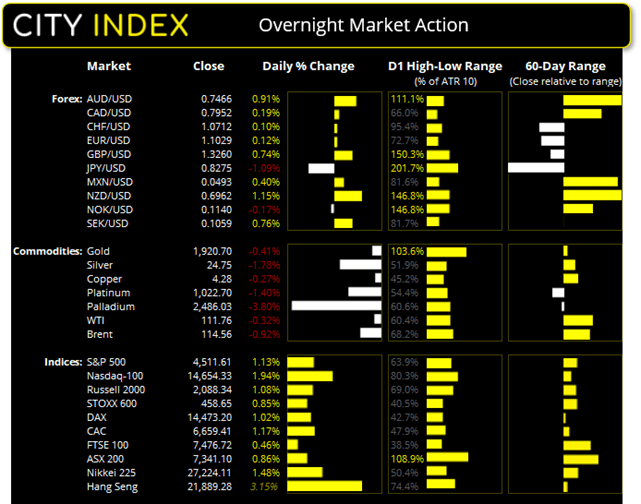
Wall Street marched higher with tech stocks taking the lead. The Nasdaq 100 rose close to 2% and tested its 200-day eMA for the first time in five weeks it has spent below it. The 100-day eMA sits at 4800 which makes it the next key level for bulls to conquer. The S&P 500 closed above its 100-day eMA, 72% of its stocks advanced (of which Tesla was the outperformer at 7.9%), and 10 of its 11 sectors rose, led by consumer discretionary. The energy sector was the only one in the red after oil prices faltered at a series of historical resistance levels.
ASX 200:
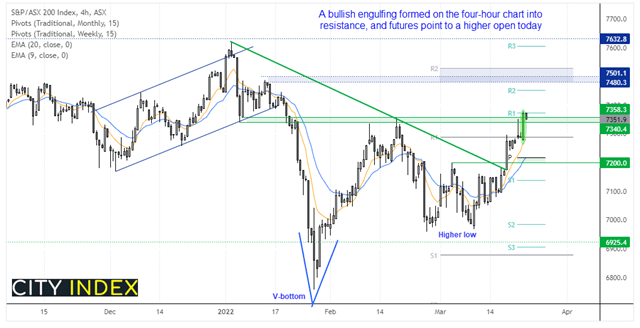
Whilst the ASX 200 had a promising start and rose to an 8-week high, 6 of its 11 sectors closed lower and only 53% of its stocks advanced. And despite its 0.9% gain, it closed the day just below the February high. In isolation, it was a decent close but at an undesirable level and breadth didn’t back it up. But thankfully we have a positive lead from Wall Street ad ASX futures point to an open above 7360, so we’re looking for process to hold above the 7340/58 zone, break above 7400 and move towards the 7480-7500 zone.
ASX 200: 7341.1 (0.86%), 22 March 2022
- Materials (3.34%) was the strongest sector and Info Tech (-1.25%) was the weakest
- 5 out of the 11 sectors closed higher
- 6 out of the 11 sectors closed lower
- 2 out of the 11 sectors outperformed the index
- 106 (53.00%) stocks advanced, 81 (40.50%) stocks declined
Outperformers:
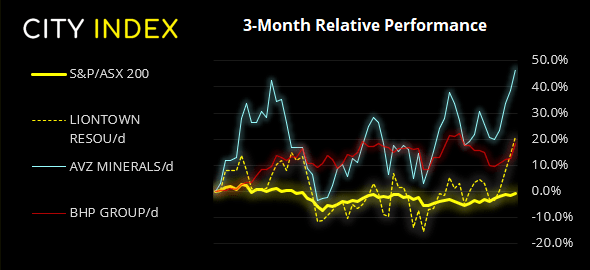
- +6.29% - Liontown Resources Ltd (LTR.AX)
- +5.79% - AVZ Minerals Ltd (AVZ.AX)
- +5.1% - BHP Group Ltd (BHP.AX)
Underperformers:
- -5.31% - Atlas Arteria Group (ALX.AX)
- -4.08% - Zip Co Ltd (Z1P.AX)
- -3.87% - Mercury NZ Ltd (MCY.AX)
It’s currently the best month for USD/JPY in over 5-years
Another day, another handle for USD/JPY as it close convincingly above 120 and even tapped 121. Positive yield differentials remain a key driver, with an extremely hawkish Fed against an extremely dovish BOJ heling prices accelerate higher overnight. JPY was the weakest major whilst AUD and NZD posted gains of over 2% against it as carry trades came back into favour.
Oil prices pull back
No sooner then WTI had tapped an 8-day high above $130 momentum reversed to see it close lower for the day. We had mentioned in yesterday’s that, without a new catalyst (or strong belief that Europe will ban Russian oil imports) that the historical highs between 110.53 – 114.83 will likely cap as resistance. At least of the near-term. And as we’re waiting for the outcome of Thursday’s NATO meeting, where the outcome of the embargo predicament will be revealed, we could expect oil to remain below those highs and carve out a choppy retracement as there’s no compelling reason to push prices materially higher or lower.
Gold between a rock and a hard place
Two key levels to watch on gold are the June high at 1916.50 and last week’s high of 1950.21, as a break of either could signal its next directional move. But gold is stuck between a rock and a as it remains supported by general risk-off flows surrounding Ukraine, yet pressured by a very hawkish Fed. We’ve seen three failed attempts to close beneath the June high over the past six days, so there is clearly demand at those lows. But we would take a daily close beneath 1900 as a sure sign that bulls are capitulating. Until then, we favour an upside break of 1950.21.
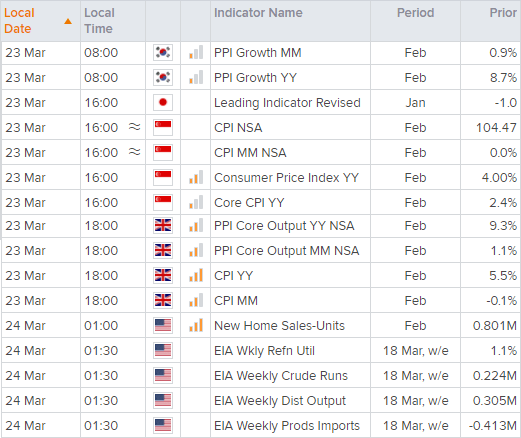
Up Next (Times in AEDT)
How to trade with City Index
You can easily trade with City Index by using these four easy steps:
-
Open an account, or log in if you’re already a customer
• Open an account in the UK
• Open an account in Australia
• Open an account in Singapore
- Search for the company you want to trade in our award-winning platform
- Choose your position and size, and your stop and limit levels
- Place the trade
Latest market news
Yesterday 01:32 PM
Yesterday 09:35 AM
Yesterday 07:23 AM
Yesterday 04:48 AM
Yesterday 12:17 AM
July 25, 2024 10:39 PM
Latest Trade Ideas articles

Yesterday 09:35 AM

Yesterday 12:17 AM

July 25, 2024 10:39 PM

July 25, 2024 05:30 PM