

Wednesday US cash market close:
- The Dow Jones Industrial rose 518.76 points (1.55%) to close at 34,063.10
- The S&P 500 index rose 95.41 points (2.51%) to close at 34,058.75
- The Nasdaq 100 index rose 498.221 points (3.7%) to close at 13,956.79
Asian futures:
- Australia's ASX 200 futures are up 106 points (1.48%), the cash market is currently estimated to open at 7,281.20
- Japan's Nikkei 225 futures are up 520 points (2.03%), the cash market is currently estimated to open at 26,282.01
- Hong Kong's Hang Seng futures are up 1003 points (4.98%), the cash market is currently estimated to open at 21,090.50
- China's A50 Index futures are up 357 points (2.65%), the cash market is currently estimated to open at 13,679.30
The Fed raised interest rates by 25 bps and vowed to forge ahead with an aggressive rate of future hikes this year. Their projections have pencilled in a full 25 bps hike at each of their next 6 meeting which will see it rise to 1.75 – 2.0% by year end, then up to 2.8% by the end of 2023.
At the press conference, Jerome Powell said they’re treating each meeting as a “live meeting” and will “move more quickly to remove accommodation” if they conclude it appropriate to do so.
Despite the aggressive path of hikes on the way, Wall Street seemingly was happy with the press conference as it also rallied with other risk assets. Perhaps it is taking its cue from ceasefire hopes, and the fact that the Fed is confident the war won’t have a material impact on the economy. The S&P E-mini contract closed above trend resistance although the 200-day eMA hovers around 4390 as a potential roadblock for bulls.
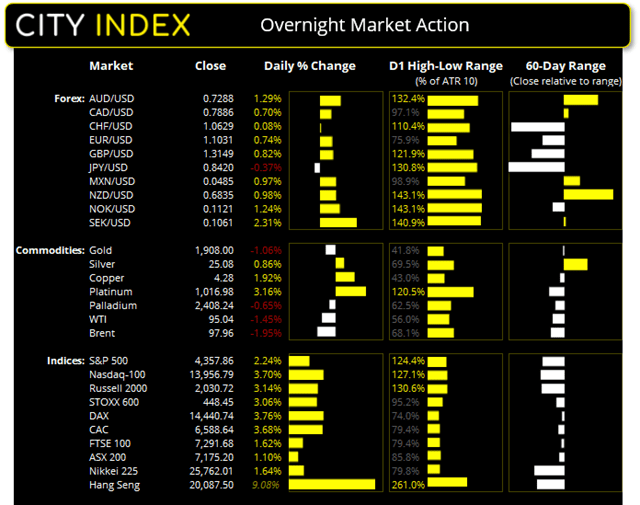
Commodities (and commodify FX) rallied after the FOMC press conference
Typically, you’d expect all currencies to fall against the dollar when a central bank confirms it is so hawkish. Yet when the Fed is concerned, for it to be so confident that the US economy is strong is effectively a boost to global confidence and trade. It also increases the odds that other banks will follow suit to raise rates, which is why we saw commodities and commodity currencies rise in tandem overnight. And there’s also the fact that the dollar had a strong rally leading into the event, so many traders booked profits – in a classic ‘buy the rumour, sell the fact’ move.
AUD and NZD were the strongest majors whilst the yen and USD were the weakest. NZD has extended its lead from overnight after rose 3.1% y/y in Q4 (-0.3% previously) and 3% q/q (-3.7% previously). And at 1.4% by the close it has been the best day for the Australian dollar since November 2020.
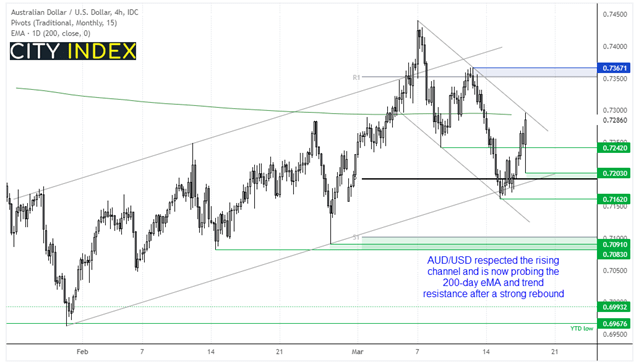
The Aussie respected the bullish channel despite several attempts to break it and has rallied back to the 200-day eMA, and now probes trend resistance. From here we’d be keen to explore dips towards the 0.7242 support level in anticipation of a breakout, unless of course prices simply break above 0.7300 and head for the 0.7350 target.
ASX 200:
Futures suggest an open above 7200, which would see it above a cluster of support levels including the 200-day eMA and 61.8% Fibonacci ratio. Ideally that level would hold as support ahead of its next leg higher.
ASX 200: 7175.2 (1.10%), 16 March 2022
- Info Tech (3.29%) was the strongest sector and Energy (0.17%) was the weakest
- 11 out of the 11 sectors closed higher
- 6 out of the 11 sectors outperformed the index
- 147 (73.50%) stocks advanced, 41 (20.50%) stocks declined
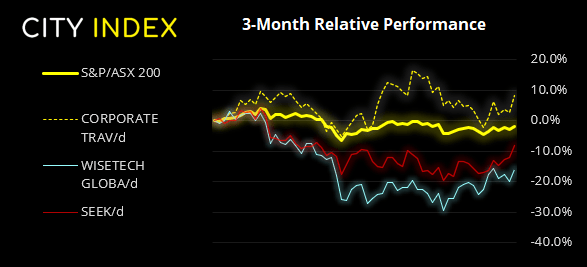
Outperformers:
- +5.26% - Corporate Travel Management Ltd (CTD.AX)
- +4.69% - WiseTech Global Ltd (WTC.AX)
- +4.28% - Seek Ltd (SEK.AX)
Underperformers:
- -3.25% - Zimplats Holdings Ltd (ZIM.AX)
- -2.35% - Seven Group Holdings Ltd (SVW.AX)
- -0.22% - Cochlear Ltd (COH.AX)
Gold hints at a swing low
It has been difficult to escape volatility lately, and gold is no different its range spanning around $180 in the past two weeks. But it is showing signs of stability after plunging from its failed bid to hit a new high and, dare we say, embark upon a bounce. A weaker dollar has certainly helped but then its possible that so has an inverted yield curve (which signals concerns of a recession, and likely Fed-induced).
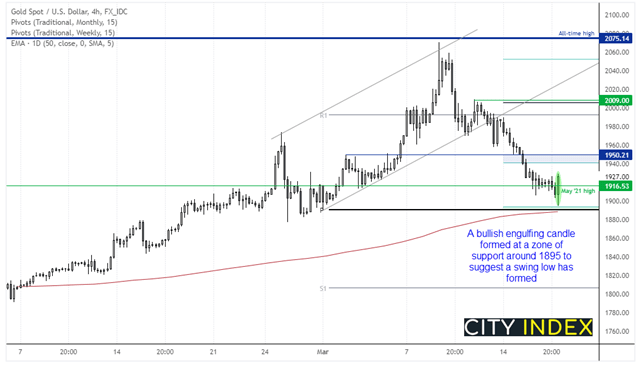
A bullish hammer formed on the daily chart and close back above the May 2021 high after an intraday dip below it. The daily low found support just above the monthly pivot and weekly S2 pivot, and a bullish engulfing candle formed on the four0hour chart. Our bias remains bullish above the monthly pivot point but would be interested in any dips towards 1916 for potential longs, with an initial target being the 1940/50 zone.
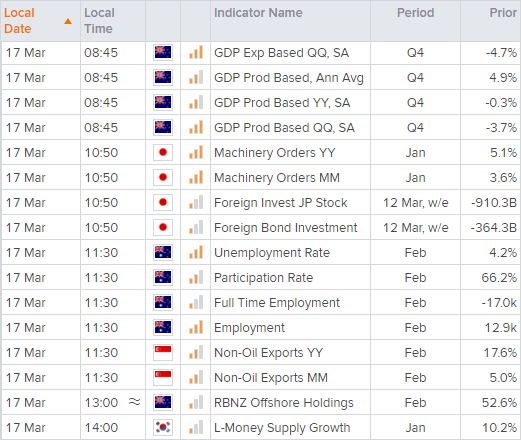
Up Next (Times in AEDT)
How to trade with City Index
You can easily trade with City Index by using these four easy steps:
-
Open an account, or log in if you’re already a customer
• Open an account in the UK
• Open an account in Australia
• Open an account in Singapore
- Search for the company you want to trade in our award-winning platform
- Choose your position and size, and your stop and limit levels
- Place the trade
Latest market news
Yesterday 01:32 PM
Yesterday 09:35 AM
Yesterday 07:23 AM
Yesterday 04:48 AM
Yesterday 12:17 AM
July 25, 2024 10:39 PM
Latest Trade Ideas articles

Yesterday 09:35 AM

Yesterday 12:17 AM

July 25, 2024 10:39 PM

July 25, 2024 05:30 PM