


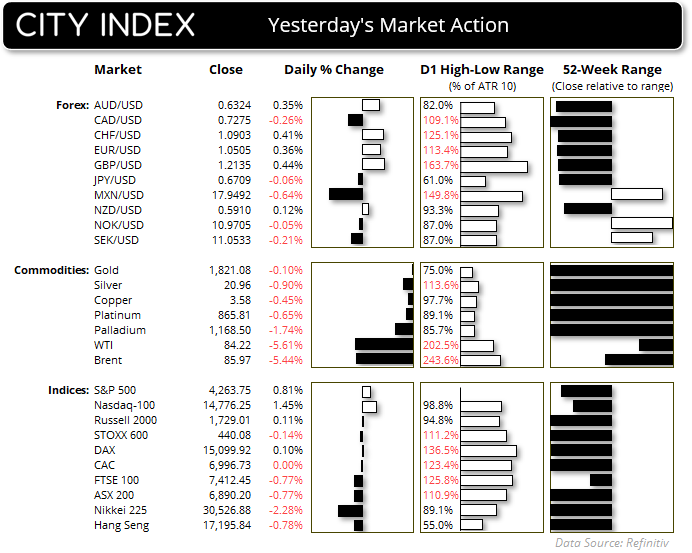
The combination of softer US economic data and yields pulling back from their highs allowed risk assets to sigh in relief and lift themselves cautiously from their cycle lows. The ISM services PMI expanded at a slower pace and the rate of US job growth slowed for a third month according to the ADP employment report. At 89k, it was the slowest rate of job growth since the data was last negative in January 2021. And whilst its m/m correlation with NFP can be at times spurious, their trends tend to follow one another over the long term so helps to set the tone for NFP on Friday to a degree. The ISM pulled back to 53.6 from 65.4 and new orders expanded at their slowest pace in nine months.
Wall Street was cautiously higher with the S&P 500 and Nasdaq erasing all of most of Tuesday’s losses, whilst the bounce on the Dow Jones only retrieved around half of the prior days selloff. But in all cases the recoveries are meek in the grand scheme of things.
Oil prices stole the show with WTI crude oil plunging around 5.4% during its worst day since September. Weak employment is clearly a red flag for oil prices, and its acceleration to the downside below $80 brings $100 back into question. Separately, OPEC+ kept their oil output policy unchanged as widely expected and are not set to meet again until November 26.
The RBNZ held interest rates at 5.5%, although the meeting was seen as a dovish hold as they continue to expect growth to soften despite GDP surpassing expectations. NZD closed flat after recovering from its 18-bar low, AUD/USD printed a small bullish inside day around its 10-month low thanks to a softer US dollar.
The Bank of Japan have taken a ‘neither confirmed nor denied’ approach when asked about whether they intervened in the currency markets. If anything, they may have at least tested the waters, but in either case USD/JPY trades in a shell-shocked state well within Tuesday’s range around 149, making it a less exciting pair to trade.
Events in focus (AEDT):
- Public holiday in China
- 10:00 – South Korean CPI
- 11:30 – Australian trade balance
- 11:30 – Hong Kong manufacturing PMI
- 17:00 – German trade balance
- 18:30 – German S&P Global construction PMI
- 19:30 – UK construction PMI
- 20:45 – ECB Lane speaks
- 22:30 - US Challenger Job cuts
- 23:30 – US jobless claims, trade balance
- 23:30 – Canada trade balance
- 01:00 – Canada IVEY PMI
- 02:30 – FOMC Member Barkin Speaks
- 03:00 – FOMC Member Daly speaks
- 03:15 – Fed Vice Chair for Supervision Barr Speaks
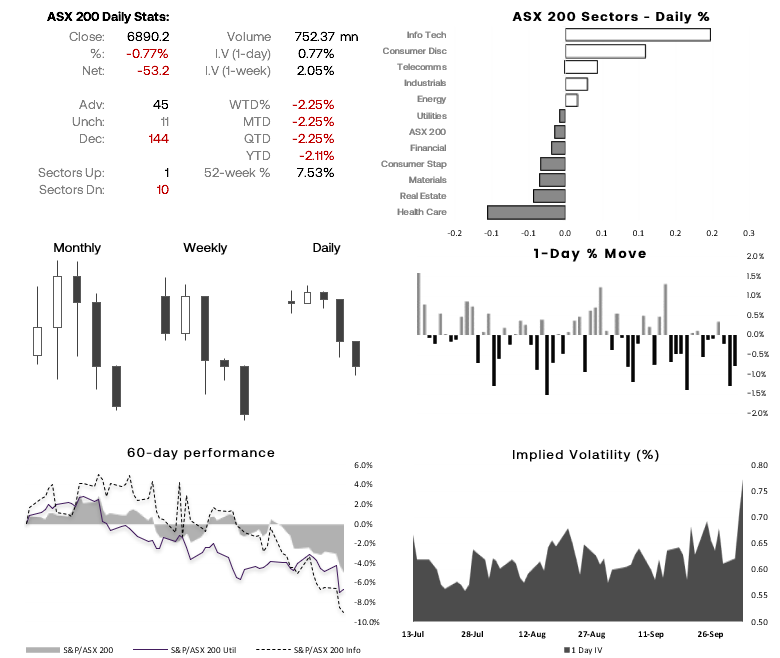
ASX 200 at a glance:
- The ASX 200 printed a fresh YTD low and closed marginally beneath key support around 6900
- However, it has not closed sufficiently enough below 6900 to call it an outright breakout in my books
- SPI futures rose 0.45% and Wall Street lifted itself from its lows, meaning the ASX cash index is expected to open around 6920 today
- However, energy stocks could be in for a nasty open due to plunging oil prices on Wednesday
- Overall the bias remains as outlined in yesterday’s report; we’d prefer to seek bearish opportunities around resistance levels or bearish
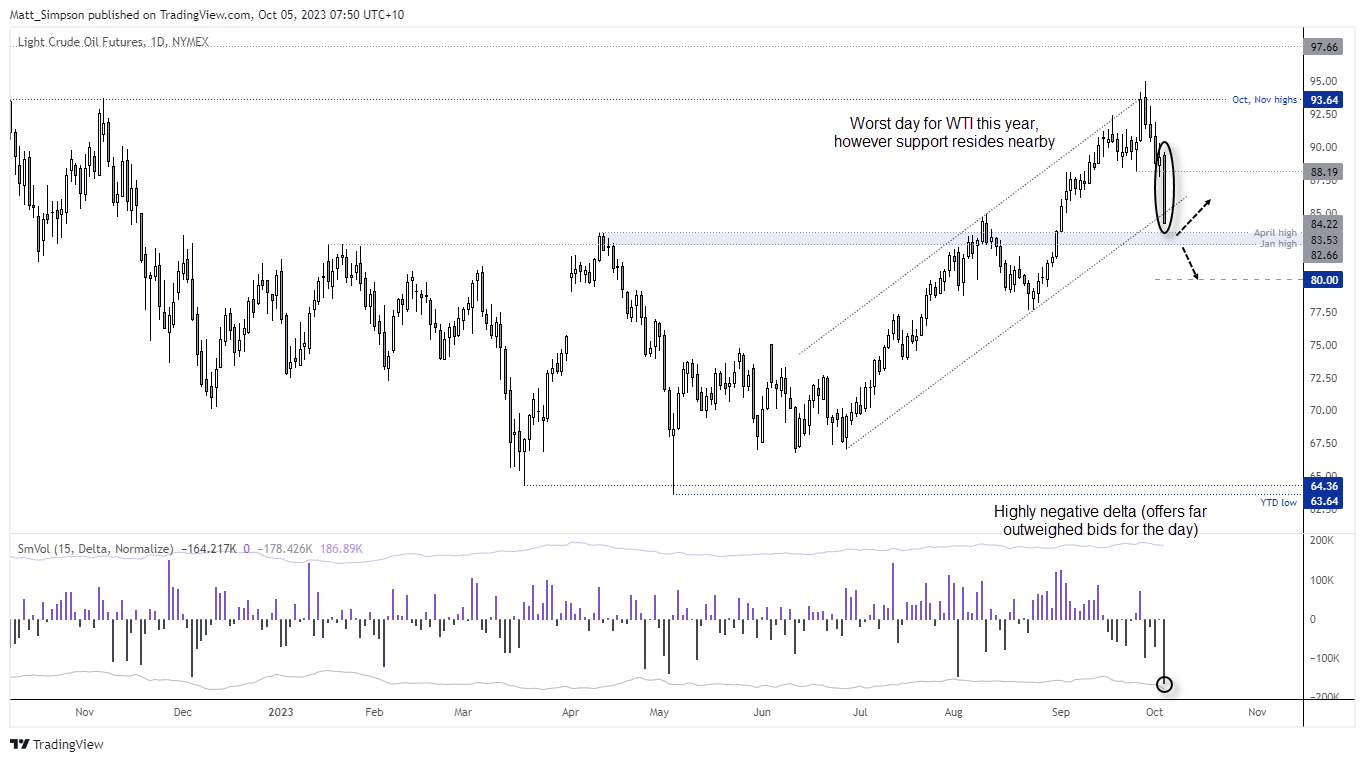
WTI crude oil technical analysis (1-hour chart):
A Marabuzo candle formed on the daily chart of WTI crude oil, which means it is a elongated engulfing candle with little or now wicks. In this case, it close at the ow of the day and as WTI’s worst day since September, and closed beneath the lower trendline of its bullish channel. Delta volume for the day (bids – asks) were highly negative to show bears aggressively entered. And those positions are likely to be defended and even added to if economic data for the week continues to point to a soft economy.
However, with the January and April highs Nearby for potential support, bears may want to be cautious around these lows. In fact, if economic data pics up for the US (and in particular tomorrow’s nonfarm payroll report) then WTI may provide a bounce. IN which case we’d look for a near-term upside target around $87, at the Marabuzo line (50% retracement of the bearish candle’s open to close range). Bears could also seek evidence of a swing high to see if the market wants to turn lower. But with volatility picking up as it has, traders may want to remain nimble and be prepared for volatile moves in either direction.
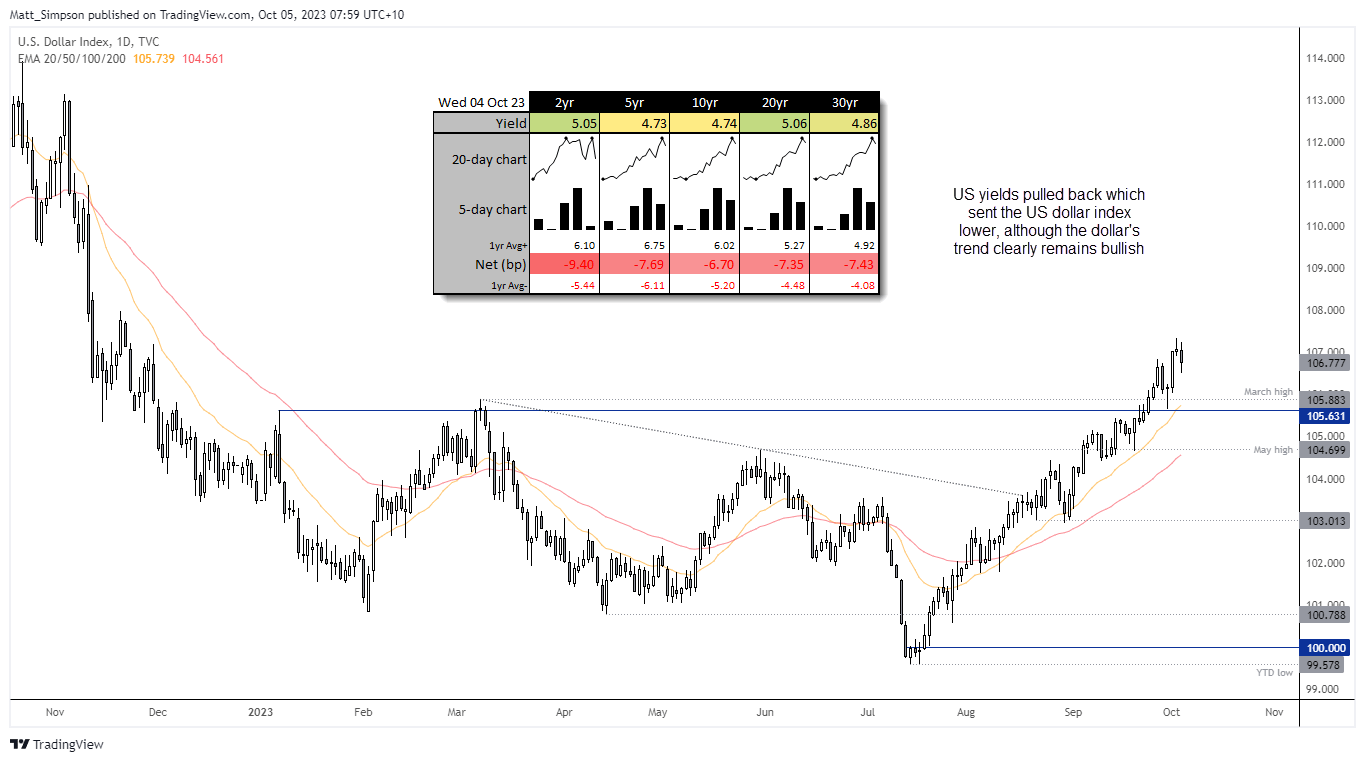
USD index technical analysis (daily chart):
As exciting as it was to see the US dollar retrace from its highs along with yields, the pullback is a drop in the ocean compared to their prior rallies. It’s possible that the dollar’s retracement could deepen, but there’s no immediate threat to its bullish trend whilst prices remain above the 105.65 low. The March high is also within the vicinity to provide potential support, and unless we see a notably weak nonfarm payroll report with refreshingly dovish comments from the Fed. And that seems unlikely at present.
View the full economic calendar
-- Written by Matt Simpson
Follow Matt on Twitter @cLeverEdge
How to trade with City Index
You can trade with City Index by following these four easy steps:
-
Open an account, or log in if you’re already a customer
• Open an account in the UK
• Open an account in Australia
• Open an account in Singapore
- Search for the market you want to trade in our award-winning platform
- Choose your position and size, and your stop and limit levels
- Place the trade
Latest market news
Today 12:54 AM
Yesterday 08:00 PM
May 4, 2024 08:00 AM
Latest Asian Open articles

May 1, 2024 10:19 PM

April 30, 2024 10:08 PM
April 29, 2024 10:44 PM

April 23, 2024 11:09 PM