


US data, yields hot
Bond yields continued to climb on Tuesday thanks to another round of hot US data, fuelling bets of a more hawkish Fed. Yields were already climbing in Tuesday’s APAC session with the Middle East conflict in a holding pattern, meaning bonds lost the little bit of demand they garnered from last week’s safe-haven flows to send yields inadvertently higher.
US core retail sales rose 0.6% m/m in September, above the 0.2% expected and August was upgraded to 0.9% (0.6% prior). Headline retail sales rose 07%, above 0.3% expected and August was upwardly revised to 0.8% (0.3% prior). These are hardly the signs of a concerned consumer, and at the very least maintains the ‘higher for longer’ approach from the Fed, if not providing them more the reason to hike again.
Commodity-FX inflation cools
Canada’s inflation data also came in softer than expected which removes the pressure from the BOC to hike at their next meeting. CPI deflated by -0.1% m/m and fell to 3.8% y/y (4% prior and expected). Perhaps more importantly, median and trimmed CPI also came in lower than expected – and these are the BOC’s preferred gauges.
New Zealand’s inflation numbers came in softer than expected, turning belief into conviction that the RBNZ are indeed done with tightening their cash rate. CPI rose 5.6% y/y, down from 6% prior and 5.9% expected, or 1.8% q/q compared with 2% expected and 1.1% prior. Interestingly, their sectoral factor model CPI fell from 5.8% to 5.2% - which is its fastest pace if disinflation on records going back to the early 90s.
Hawkish RBA mins support AUD/USD
The RBA minutes were more hawkish than expected or their October statement suggested, with the central bank acknowledging that “upside risks [to inflation] were a significant concern”, which raises the odds of a hike in November.
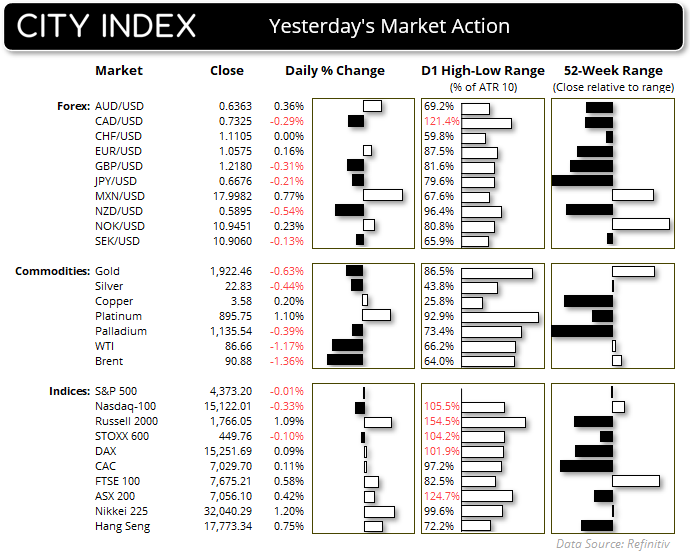
AUD/USD managed to bounce for a second day, in line with yesterday’s bullish bias. A move to 0.6380 or even 0.6400 remains feasible, although lower timeframes may need to be referred to, for bulls to find an adequate risk-to-reward ratio, whilst looking for prices to hold above 0.6340
Mixed data form Europe
UK employment and wages data hasn’t provided much clarity for what to expect in today’s key inflation report. Wages remains relatively high at 7.8% y/y (or 8.1% including bonus), job growth was up 1.2% yet job vacancies were -43k lower from the month prior. Today’s CPI data could be the decider as to whether the BOE hike again today.
A better-than-expected ZEW report for Germany and the eurozone allowed EUR/USD to rise to a 3-day high, and straight into trend resistance highlighted in Monday’s European Open report.
Events in focus (AEDT):
- Public holiday
- 09:35 – RBA Gov Bullock Speaks
- 13:00 – China GDP, fixed asset investment, industrial production, retail sales, unemployment, NBS press conference
- 17:00 – UK CPI, PPI
- 20:00 – Eurozone CPI, ECB president Lagarde speaks
- 23:30 – US building permits
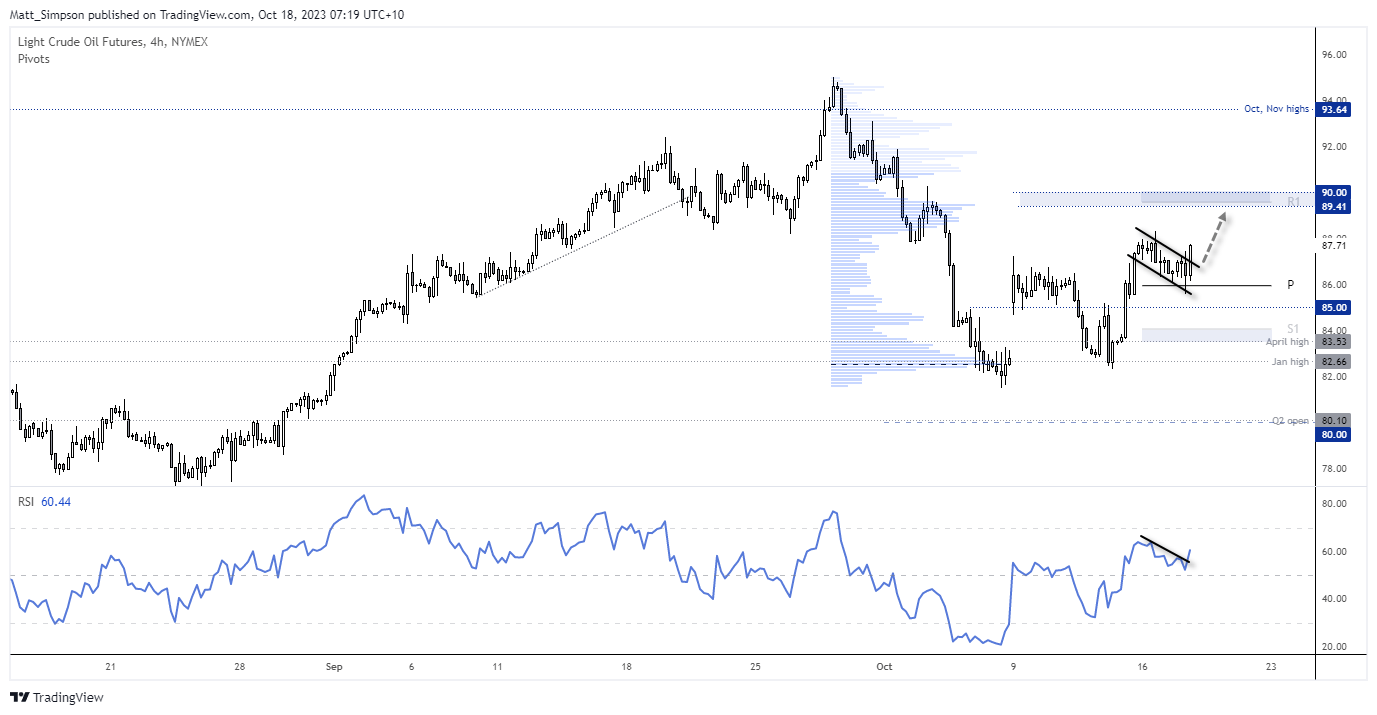
WTI crude oil technical analysis (4-hour chart):
I don’t have a great deal to add to yesterday’s analysis, but we have seen the required pullback into the weekly pivot. Support was found, a swing low formed and WTI is on the cusp of confirming a bullish engulfing candle on the 4-hour chart. The bias remains bullish above yesterday’s low, bulls could consider dips towards the lows or a break above 88 for an assumed run to the 89.40 – 90 resistance zone.
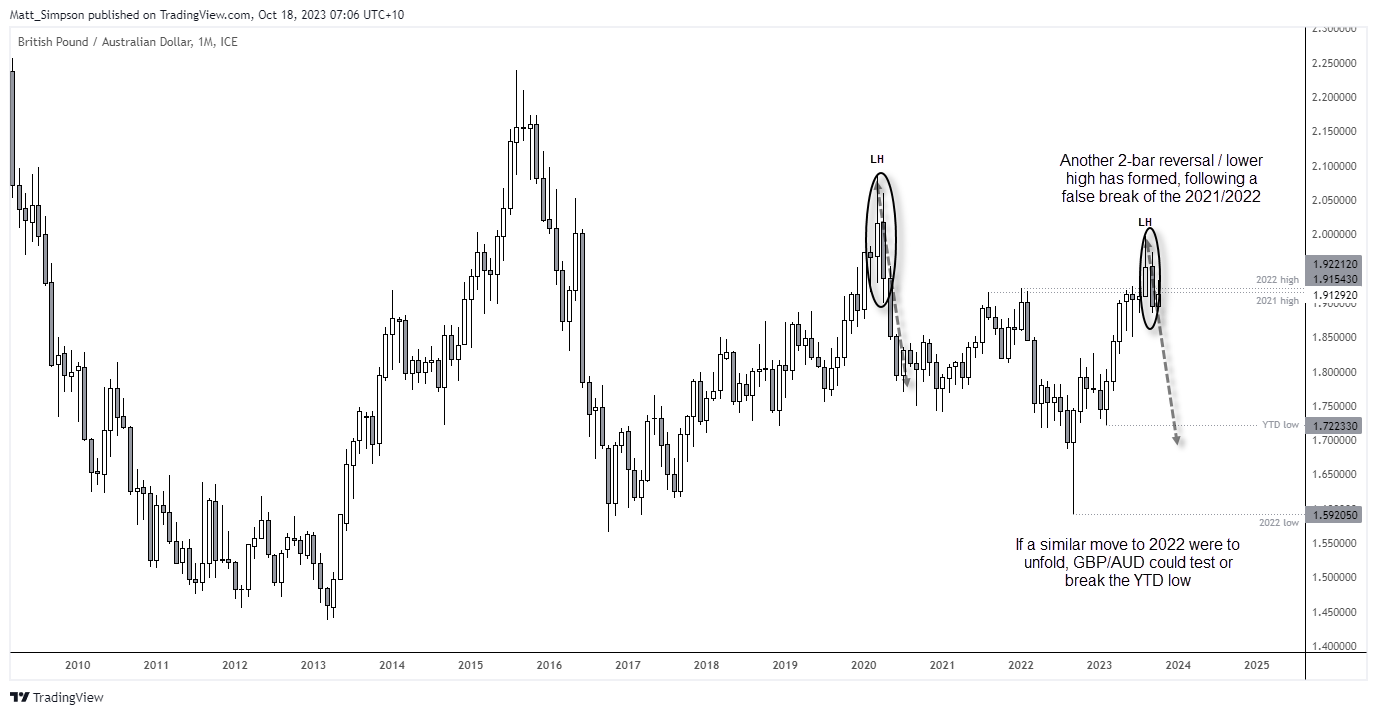
GBP/AUD technical analysis (monthly chart):
If the monthly chart is anything to go by, I am seriously wondering whether we’re about to see a large move unfold on GBP/AUD over the coming months. September’s false break above the 2021 / 2022 highs has been fully reversed with a bearish engulfing month, which also forms a 2-bar reversal and lower high. If any decline were to be of a similar magnitude to the fall in 2020, it could test or break the YTD low.
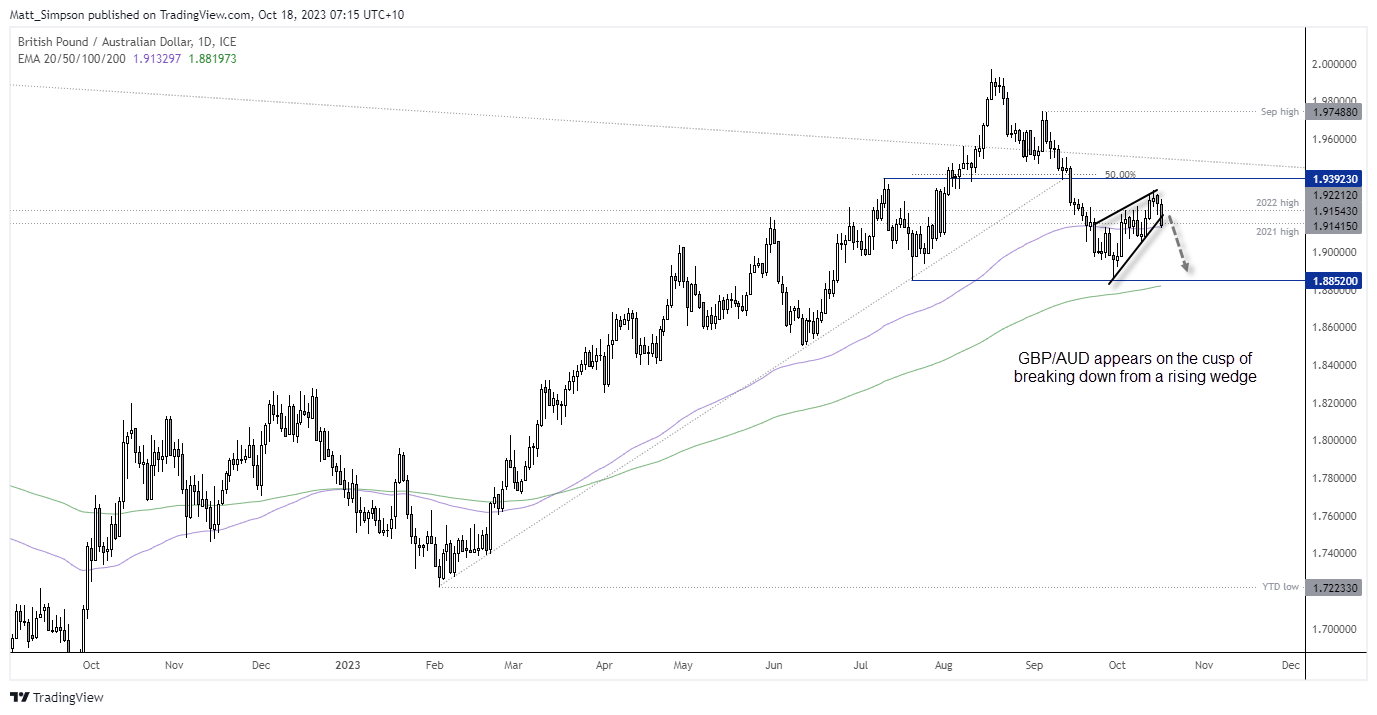
GBP/AUD technical analysis (daily chart):
A textbook bearish trend has formed on the daily chart of GBP/AUD. Whilst prices have entered a period of consolidation and retraced against the trend, momentum is turning lower and the cross appears on the cusp of breaking own from a rising wedge, which is a bearish continuation pattern. Such patterns project a measured move to the base, which is just above the 200-day EMA and 1.88 handle. For now, we’re waiting for a break of its 100-day EMA.
View the full economic calendar
-- Written by Matt Simpson
Follow Matt on Twitter @cLeverEdge
How to trade with City Index
You can trade with City Index by following these four easy steps:
-
Open an account, or log in if you’re already a customer
• Open an account in the UK
• Open an account in Australia
• Open an account in Singapore
- Search for the market you want to trade in our award-winning platform
- Choose your position and size, and your stop and limit levels
- Place the trade
Latest market news
Yesterday 01:32 PM
Yesterday 09:35 AM
Yesterday 07:23 AM
Yesterday 04:48 AM
Yesterday 12:17 AM
July 25, 2024 10:39 PM
Latest Asian Open articles

July 25, 2024 10:39 PM

July 24, 2024 10:10 PM

July 23, 2024 11:29 PM

July 22, 2024 10:43 PM