


Asian Indices:
- Australia's ASX 200 index fell by -2.2 points (-0.03%) and currently trades at 7,311.70
- Japan's Nikkei 225 index has risen by 415.75 points (1.29%) and currently trades at 32,720.00
- Hong Kong's Hang Seng index has fallen by -293.75 points (-1.54%) and currently trades at 18,781.51
- China's A50 Index has fallen by -68.67 points (-0.55%) and currently trades at 12,496.88
UK and Europe:
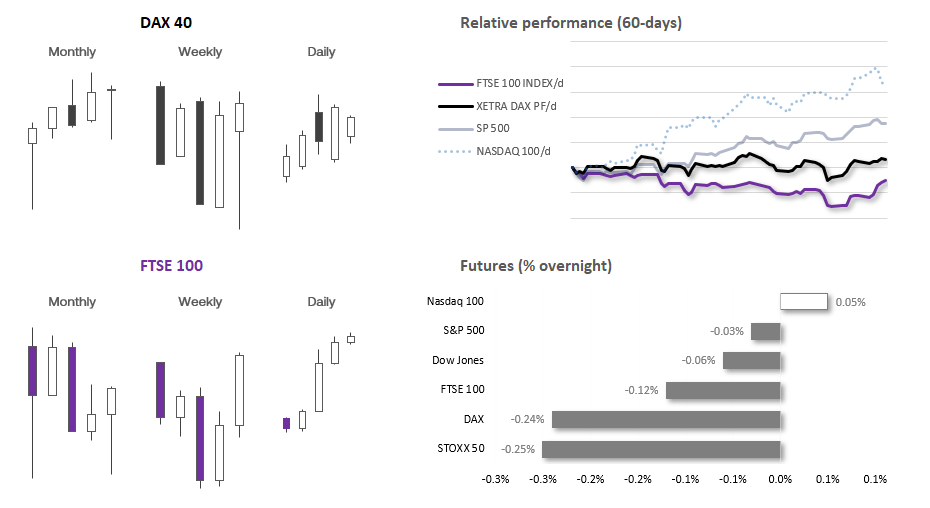
- UK's FTSE 100 futures are currently down -11.5 points (-0.15%), the cash market is currently estimated to open at 7,652.23
- Euro STOXX 50 futures are currently down -11 points (-0.25%), the cash market is currently estimated to open at 4,380.41
- Germany's DAX futures are currently down -39 points (-0.24%), the cash market is currently estimated to open at 16,138.22
US Futures:
- DJI futures are currently down -24 points (-0.07%)
- S&P 500 futures are currently down -1.75 points (-0.04%)
- Nasdaq 100 futures are currently up 4.75 points (0.03%)
Flash PMI data for Germany, eurozone, UK and the US are the key data points today. So far, data has underwhelmed in the Asian session with Australia’s service PMI contracting at its fastest pace this year and Japan’s manufacturing PMI contracting for a second month and at a faster rate than expected. Is this theme set to continue across Europe and the US?
The general theme with global PMIs is that manufacturing has led the way lower and service PMIs have topped (with some already contracting). On one hand that is good news for deflation but, if numbers continue to deteriorate too rapidly, market will once again begin to price in a global recession and weigh on risk assets accordingly.
A weak set of PMIs for the UK could take some pressure off of the BOE to hike so aggressively, although Friday’s strong retail sales serves as a reminder that consumers are spending their way through inflation. US services PMI seems to be the exception
Asian shares were higher on Monday on renewed expectations for the BOJ to keep policy unchanged on Friday. There had been speculation that they may widen their YCC band until a Reuters report on Friday cited sources as saying no action was likely needed. The Japanese government also said on Monday that they expect inflation to fall to 1.5% in 2024, further cementing a ‘no action’ BOJ meeting on Friday and boosting sentiment for equities.
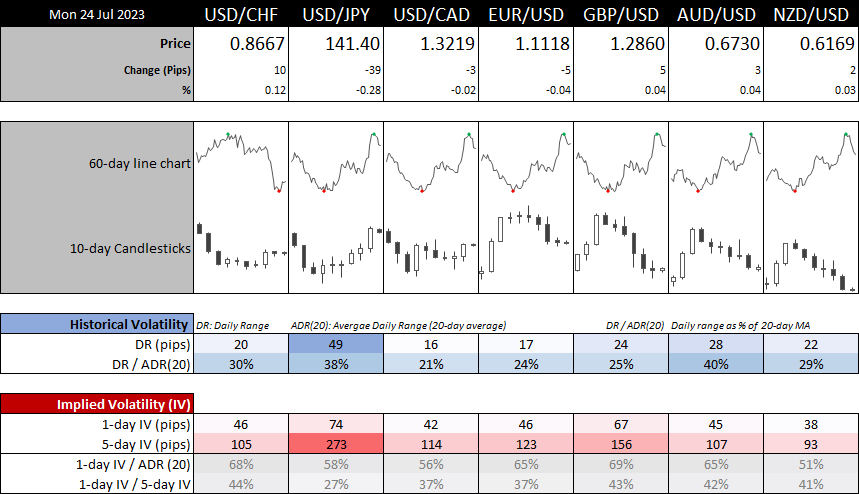
- EUR/GBP enjoyed its most bullish week in 24 following its false break of 0.8518 support the week prior. However, upper wicks on the daily chart on Thursday and Friday suggests it may want to retrace towards the 38.2% Fibonacci level ~0.8625
- EUR/USD retraced for a fourth day on Friday but its small doji above 1.1100 suggests it is trying to carve out a swing low on the daily chart.
- GBP/USD was lower for a sixth day by Friday’s close, which is a bearish sequence not seen in 10 months. With RSI (2) being oversold on the daily chart, we see the potential for a near-term bounce towards 1.3000 – although it may struggle to break above that level ahead of the FOMC meeting without a fresh catalyst
- USD/CAD formed a small bullish pinbar week, with a large bullish hammer the week prior to suggest it is trying to carve out a swing low
- USD/JPY
- USD/CHF snapped a 3-week losing streak last week. Thursday’s bullish range expansion day suggests an important swing low formed last Tuesday, so we’re not looking for a bullish breakout from the consolidation range on the 1-hour chart
- 1-day implied volatility for forex majors remain relatively low compared with their 20-day average or 5-day IV, so we could be in for a quiet session unless flash PMIs provide some curve balls.
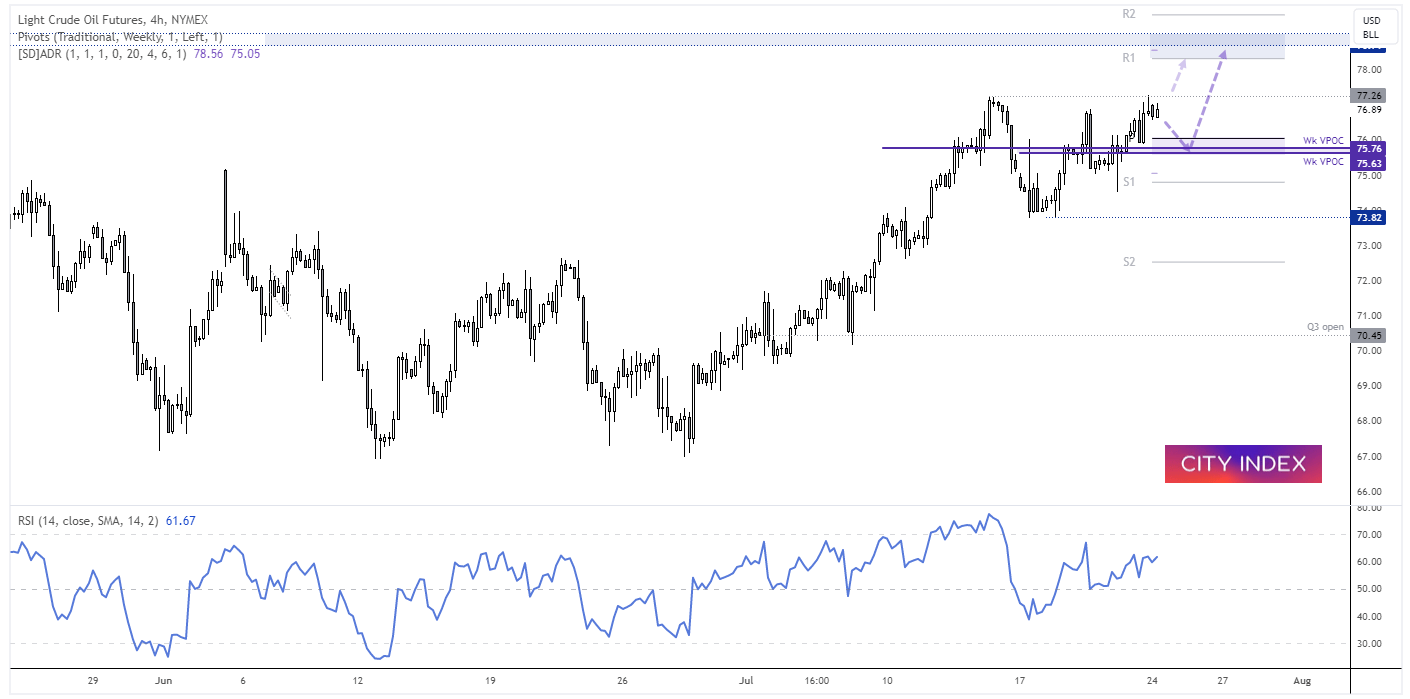
WTI crude oil 4-hour chart:
As noted in the weekly COT report, large speculators on WTI crude oil have continued to cover some of their shorts which has fuelled the rally from $67 to $77. Whilst the bullish trend structure is taking shape on the daily chart, the RSI (2) is within the overbought zone and has formed a bearish divergence with price to warn of a potential pullback over the near-term.
With that said, the rise of geopolitical risks and concerns of supply chain disruptions could keep prices supported and perhaps see a bullish breakout in tensions escalate.
The 4-hour chart also shows a bearish divergence forming on the RSI (2) and (14), so perhaps we’ll see a pullback over the near-term whilst prices remain beath the 77.26 high. Yet two weekly VPOCs (volume point of control) sit around 75.63/76 and might provide an area of support, or a potential target for bears to focus on over the near-term. But due to geopolitical risks and evidence of short covering, we favour an eventual break above 77.30 and for a move to wards 79.0.
View the full economic calendar
-- Written by Matt Simpson
Follow Matt on Twitter @cLeverEdge
How to trade with City Index
You can trade with City Index by following these four easy steps:
-
Open an account, or log in if you’re already a customer
• Open an account in the UK
• Open an account in Australia
• Open an account in Singapore
- Search for the market you want to trade in our award-winning platform
- Choose your position and size, and your stop and limit levels
- Place the trade
Latest market news
Today 12:54 AM
Yesterday 08:00 PM
May 4, 2024 08:00 AM
Latest Trade Ideas articles


May 4, 2024 08:00 AM

May 3, 2024 07:49 AM

May 3, 2024 07:01 AM