


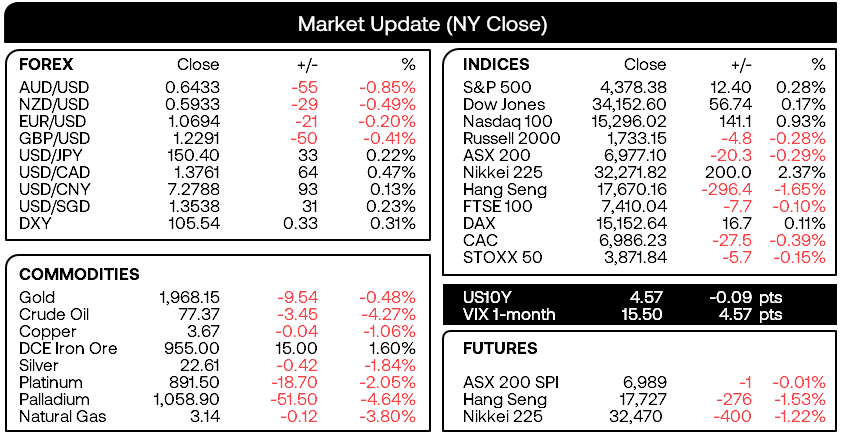
Market Summary:
The RBA hiked their cash rate by 25bp to 4.35% in line with the consensus view, although AUD/USD was quick to selloff as the statement lacked the apparent hawkish tone that markets were positioned for. Hot inflation, producer prices and retail spending had seen some banks upwardly revise their forecasts for a November and December hike, yet the minor tweak to the final paragraph suggests the RBA’s decision to hike once more remains on a meeting-by-meeting basis as data comes in.
AUD/USD was the weakest FX major during its worst day in over three weeks, AUD/JPY rolled over after just failing to retest its June high / YTD high and Australian yields were also off by at least 15 bps across the curve.
- The US dollar was the strongest FX major and rose for a second day as it recouped some of Friday’s heavy losses, although the lack of momentum and lower US yields suggests its part of a retracement for USD
- Fed member Bowman said he expected the Fed will have to tighten rates further whilst Logan said that inflation remains too high
- Gold fell for a second day in line with yesterday’s bearish bias before finding support just above the September high. Given half of yesterday’s range was the low wick then gold may find some stability over the near-term.
- Oil prices also continued to fall, with WTI falling over -4% on Tuesday and breaking beneath $80 in line with my bearish bias following soft Chia data and rising OPEC exports
- Wall Street indices pushed higher which saw the Nasdaq 100 notch up its eight consecutive bullish day, whilst the S&P 500 and Dow Jones have now risen for seven
Events in focus (AEDT):
- 08:45 – New Zealand employment
- 11:30 – Australian building approvals
- 13:00 – New Zealand inflation expectations
- 16:00 – Japan coincident / leading index
- 18:00 – German CPI
- 21:00 -Eurozone retail sales
- 21:15 – Fed governor Cook speaks
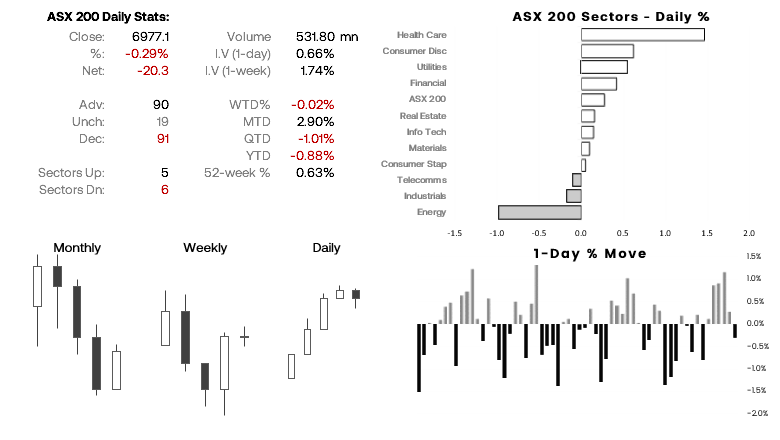
ASX 200 at a glance:
- The ASX 200 snapped a 5-day winning streak following the RBA’s decision to hike
- Only 6 of its 11 sectors declined and the daily range was relatively small
- And given the lack of bearish follow-through, the hike was seemingly priced in and ASX traders live in hope the terminal rate of the cycle is 4.35%
- Whilst Wall Street provided a positive lead, SPI 200 futures were flat and it looks like the ASX 200 needs to decide again whether it has the strength to challenge key resistance around 7,000
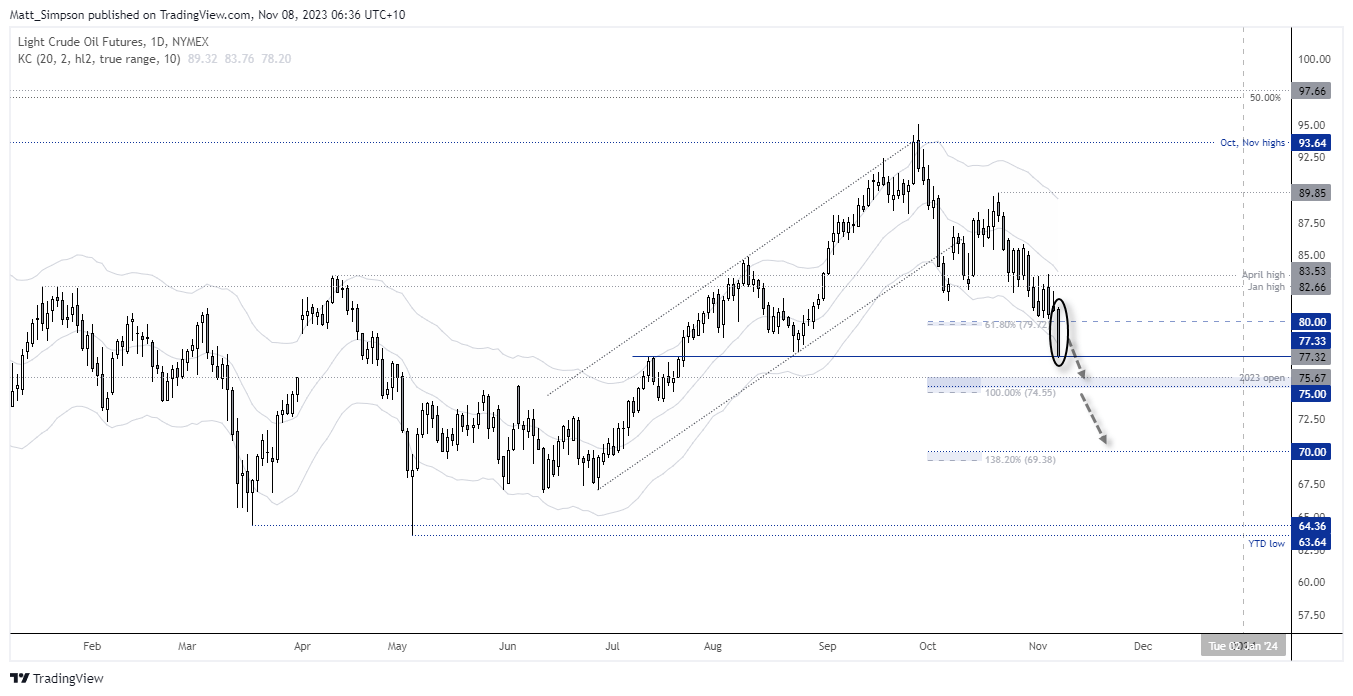
WTI crude oil technical analysis (chart):
I’m happy to say I was one of the few calling for lower oil prices despite the consensus making +$100 calls. The clues included two suspiciously small ‘bullish’ weekly candles despite an influx of Middle East headlines whilst managed funds and large speculators were increasing their gross-short exposure. Alas, oil prices have since fallen to a 4-month low and show the potential to fall further.
WTI crude oil broke firmly beneath $80 bias before finding support around the $77.33 high, which now brings the $75 and $70 handles into focus for bears near the 100% and 138.2% Fibonacci projection levels. The fact that WTI closed on support at the low of the day suggests any initial pullback prior to a break may be on the small side.
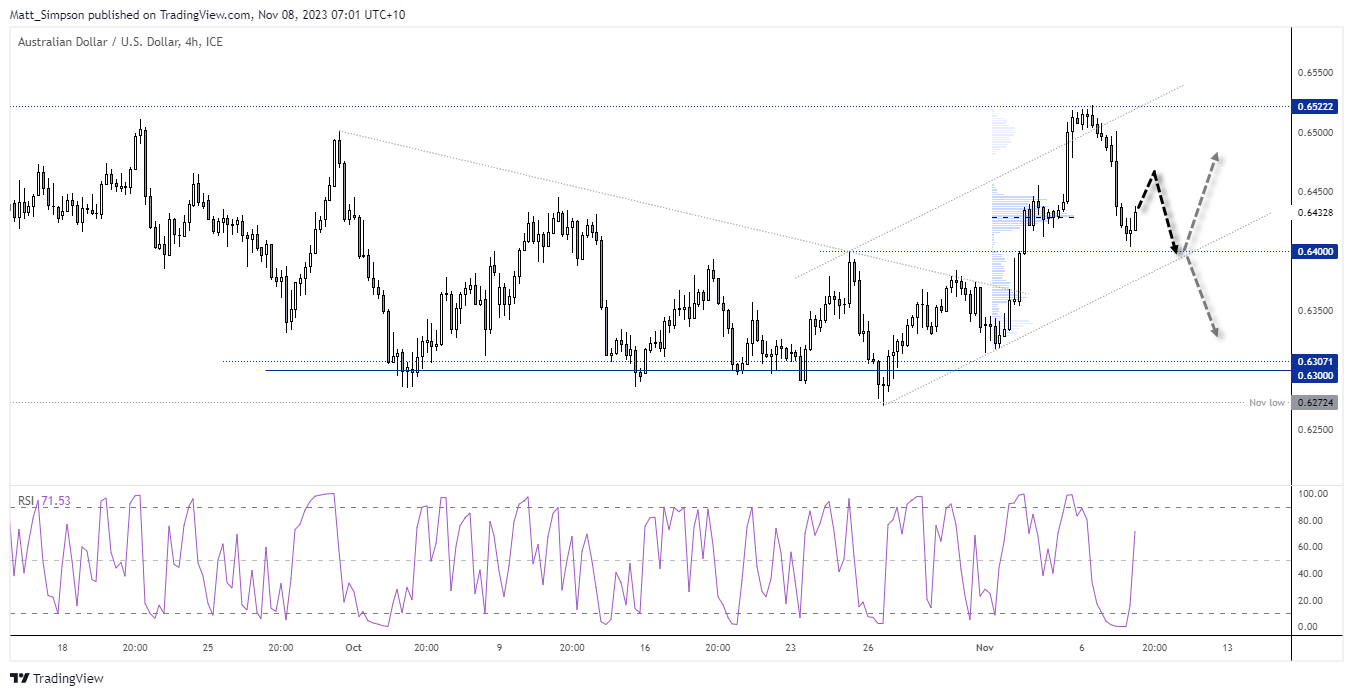
AUD/USD technical analysis (chart):
Traders were positioned for a hawkish statement they seemingly weren’t given, although the interpretations of statements can vary widely from a central bank’s intent. Stil, AUD/USD reacted a I suspected it would under this scenario; it sold off and failed to break key resistance. It also fell to the 0.6430 area, near the high-volume node from the prior leg and came close to probing 0.64.
Given key support at 0.64 held, RSI (2) reached oversold and curled higher with prices, a small bounce could be due today. That leaves the potential for near-term bullish setups, or perhaps bears may want to wait on the sideline for evidence of a swing high to fade into around potential resistance levels.
View the full economic calendar
-- Written by Matt Simpson
Follow Matt on Twitter @cLeverEdge
How to trade with City Index
You can trade with City Index by following these four easy steps:
-
Open an account, or log in if you’re already a customer
• Open an account in the UK
• Open an account in Australia
• Open an account in Singapore
- Search for the market you want to trade in our award-winning platform
- Choose your position and size, and your stop and limit levels
- Place the trade
Latest market news
Today 01:39 PM
Today 11:05 AM
Today 10:46 AM
Latest Asian Open articles

April 23, 2024 11:09 PM

April 22, 2024 10:48 PM

April 18, 2024 11:27 PM

April 17, 2024 11:16 PM