


Market Summary:
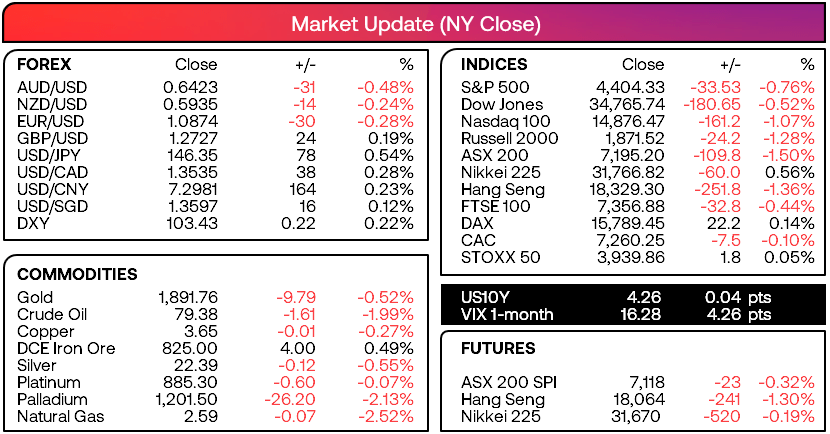
- FOMC minutes caught markets off guard with a divide over whether the Fed needed to continue hiking rates further.
- With “Most participants” continuing to see “significant upside risks to inflation, which could require further tightening of monetary policy", it came as a shock to stock markets and sent Wall Street lower, bond yields and the US dollar higher.
- The S&P 500 closed beneath trend support from the March low, falling to a 5-week low and closed just above 4400. The Nasdaq 100 also fell for a second day and closed below 15,000 for the first time in 7 weeks.
- USD/JPY rose for an eight day – a bullish sequence not exceeded since October and actually went on to print 12. But with a member of the MOF (Ministry of Finance) sending a verbal warning yesterday, it seems only a matter of time before the voices become more frequent and the markets may pull back by themselves or the MOF might instruct the BOJ (Bank of Japan) to intervene.
- Zhongrong International Trust Co, a leading Chinese trust firm, missed “dozens” of investment payments over the past month according to a report, whilst China’s home prices fell for the first time in a year. This added to the weak sentiment following PBOC’s decision to cut rates and a slew of weak economic data on Tuesday.
- AUD/USD was the weakest forex major, is currently on track for its fifth bearish week and closed at a 9-month low.
- Spot gold prices closed below 1900 for the first time in five months, although a potential ‘bone’ for bulls to chew on is that the front-month futures contract remains above 1900 and trades around 1923.
- UK inflation data once again came in hotter than expected, although not to the degree it annuls the (arguably early) case of peak inflation.
- Canada’s inflation data also exceeded expectations earlier this week, raising the prospects that the BOC (Bank of Canada) may need to hike rate by another 25bo to 5.25%.
- The RBNZ (Reserve Bank of New Zealand) held interest rates steady for a third meeting at 5.5% as widely expected, although their statement warned that “there is a risk that activity and inflation measures do not slow as much as expected”, which suggests rates could remain at current levels for longer.
Events in focus (AEDT):
- 08:45 – New Zealand PPI
- 09:50 – Japan’s core machinery, trade balance
- 11:30 – Australian employment report: Bets have been placed that the RBA are done hiking rates and AUD/USD remains under pressure from weak China data and FOMC minutes. But it could face selling further pressure if we finally see the defiant and robust employment report show cracks. But with it harder for employment to get much better, another strong report may not be such a bullish catalyst.
- 22:30 – US jobless claims
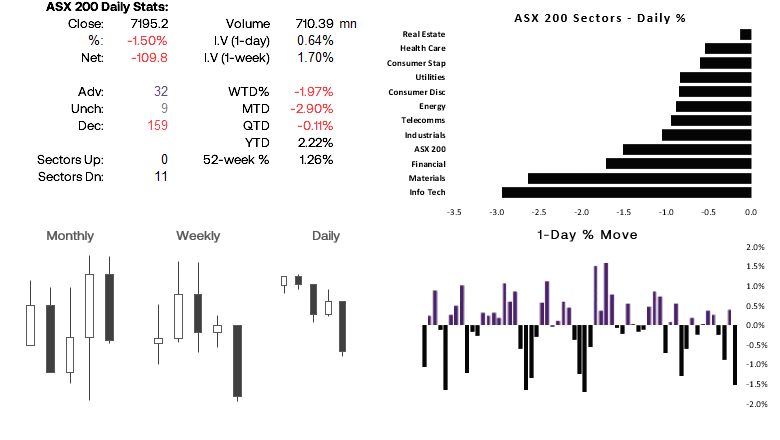
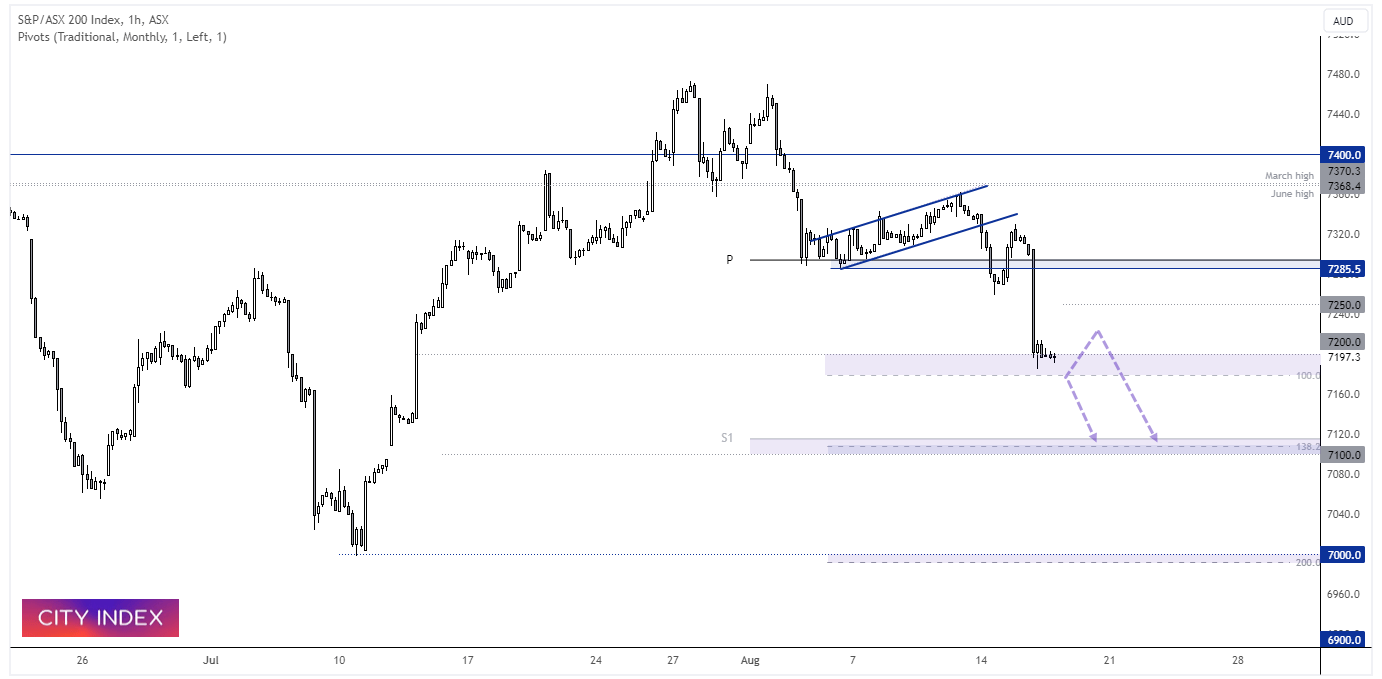
ASX 200 at a glance:
- After a 1-day pullback (and small bullish inside day), the ASX 200 suffered its worst day in 28 and reached the initial downside target around 7200.
- Weak lead from Wall Street and SPI futures trading -0.32% lower overnight points to a weaker open today, and I’m now looking for its potential to continue lower to the next target around 7100
- The question is whether it will be direct losses, or the market will try to stabilise or even retrace before its next anticipated leg lower
- Intraday resistance levels include 7206, 7214, 7250
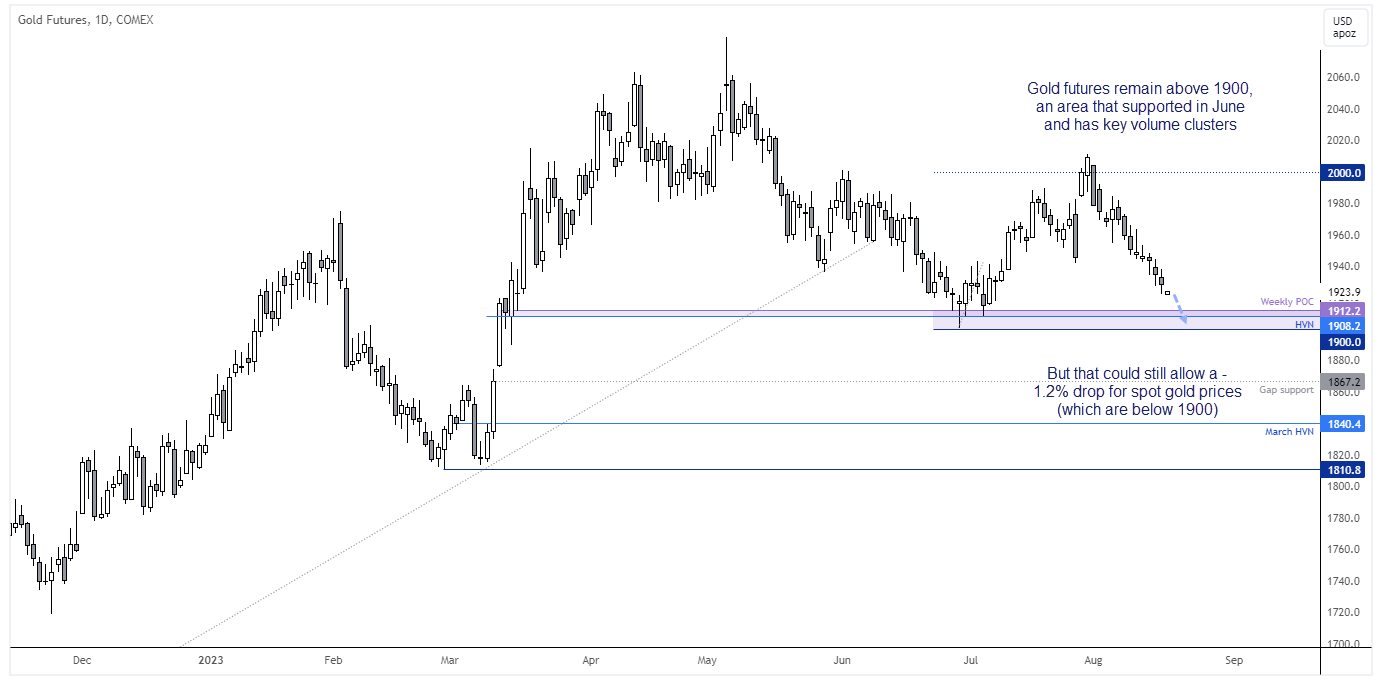
Gold technical analysis (futures, daily chart):
As mentioned above, spot gold prices fell beneath 1900 for the first time in five months yesterday. And whilst gold is notorious for hammering stops with lower spikes before any sort of rebound, I’m not convinced a low is in just yet with the strength of the US dollar and rising yields. Furthermore, the front-month futures gold contract could fall another -1.2% before it reaches the milestone 1900 level, and if it does then spot prices will follow. However, as we noted back in June, the 1900 – 1912 area is quite a significant level for bulls as there was heavy trading volumes in that area during March’s rally. I’d therefore at least expect it to hold as support initially. But if it does eventually give way, it could make for a shar fall through to 1840.
USD/JPY technical analysis (daily chart):
Rising yield differentials, hawkish FOMC minutes and a general lust for the US dollar and bond selloff has seen USD/JPY rise to a new YTD high, despite the growing risks that MOF or BOJ members will become more vocal about ‘yen volatility’. It closed higher for an 8th day - a bullish sequence not seen since October – and is fast approaching a key resistance zone around 147. The lower bound of 146.59 marks the high of the day when a key US inflation report came in soft back in November, whilst the upper area of 147.09 marks a high-volume nide from the choppy top at the 2022 high. Therefore, even if MOF and BOJ members remain tight lipped, there’s at least a technical reasons to suspect a pause in trend could be nearing (if not a pullback).

-- Written by Matt Simpson
Follow Matt on Twitter @cLeverEdge
How to trade with City Index
You can trade with City Index by following these four easy steps:
-
Open an account, or log in if you’re already a customer
• Open an account in the UK
• Open an account in Australia
• Open an account in Singapore
- Search for the market you want to trade in our award-winning platform
- Choose your position and size, and your stop and limit levels
- Place the trade
Latest market news
Yesterday 10:44 PM
Yesterday 05:00 PM
Yesterday 03:13 PM
Latest Forex articles

Yesterday 10:44 PM

Yesterday 05:00 PM

Yesterday 03:13 PM
Yesterday 05:56 AM