


Market Summary:
US inflation data was broadly higher than expected, which triggered well defined moves in favour of the US dollar and to the detriment of all else. Fed fund futures now favour a hold in May.
Gold broke below $2000 and posted its worst day of the year, Wall Street gapped lower which saw the Nasdaq suffer its most bearish day since October and worst CPI day in 20 months. Bond yields surged with the US 2 and 10-year reaching a YTD high.
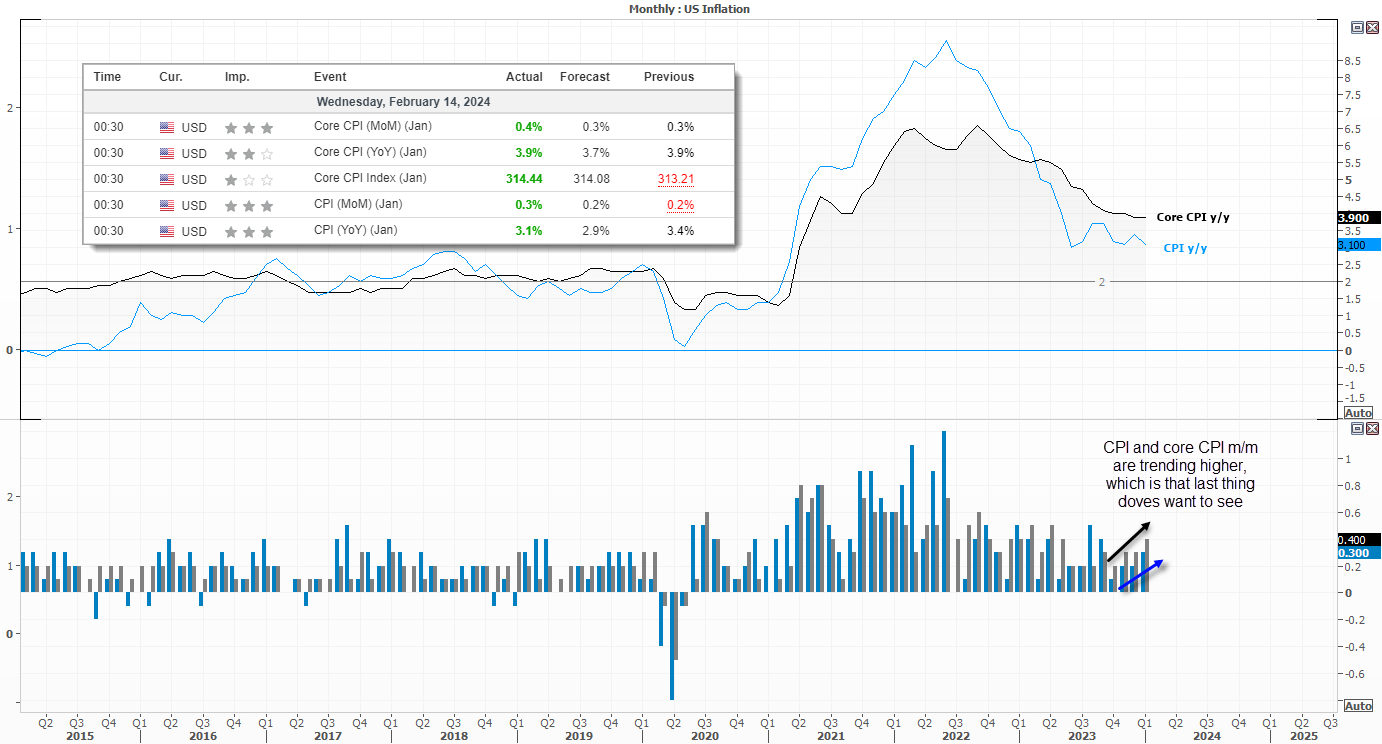
As for inflation itself, the consensus was hoping for too much. The annual rates are effectively moving sideways, but one thing to keep an eye on is the trend higher on the monthly CPI and core CPI gauges. At 0.4% m/m, core CPI reached a 9-month high and well above its long-term average of 0.3%.
Nobody wants to discuss hikes (yet), and I don't expect the Fed to come out with a knee-jerk reaction and tout them considering how slow they were to begin hiking last time (who remembers 'transitory inflation?!). But if CPI continues to rise then a hike is not impossible, even if it’s not the base case right now.
- The US dollar was king of the mountain and broadly higher against all FX majors, however resistance looms around 105 – at least over the near term
- The Swiss franc was the weakest following softer inflation figures and bets that the SNB could begin easing before the ECB
- USD/CAD closed at a 3-month high and confirmed an inverted head and shoulders pattern on the daily chart, which projects an upside target around 1.375
- EUR/USD closed beneath the December low after a textbook low-volatility retracement higher from it (almost with a dead-cat bounce quality)
- AUD/USD and NZD/USD were a close join second place at the bottom of the board due to the risk-off tone and lower inflation expectations from an RBNZ survey on Tuesday (which trimmed bets that the RBNZ could hike twice more, as ANZ now estimate)
Events in focus (AEDT):
- 08:45 – New Zealand electronic card retail sales, food price index
- 18:00 – UK CPI
- 21:00 – EU employment, GDP
- 01:30 – Fed Goolsbee speaks
- 02:00 – BOE governor Bailey speaks
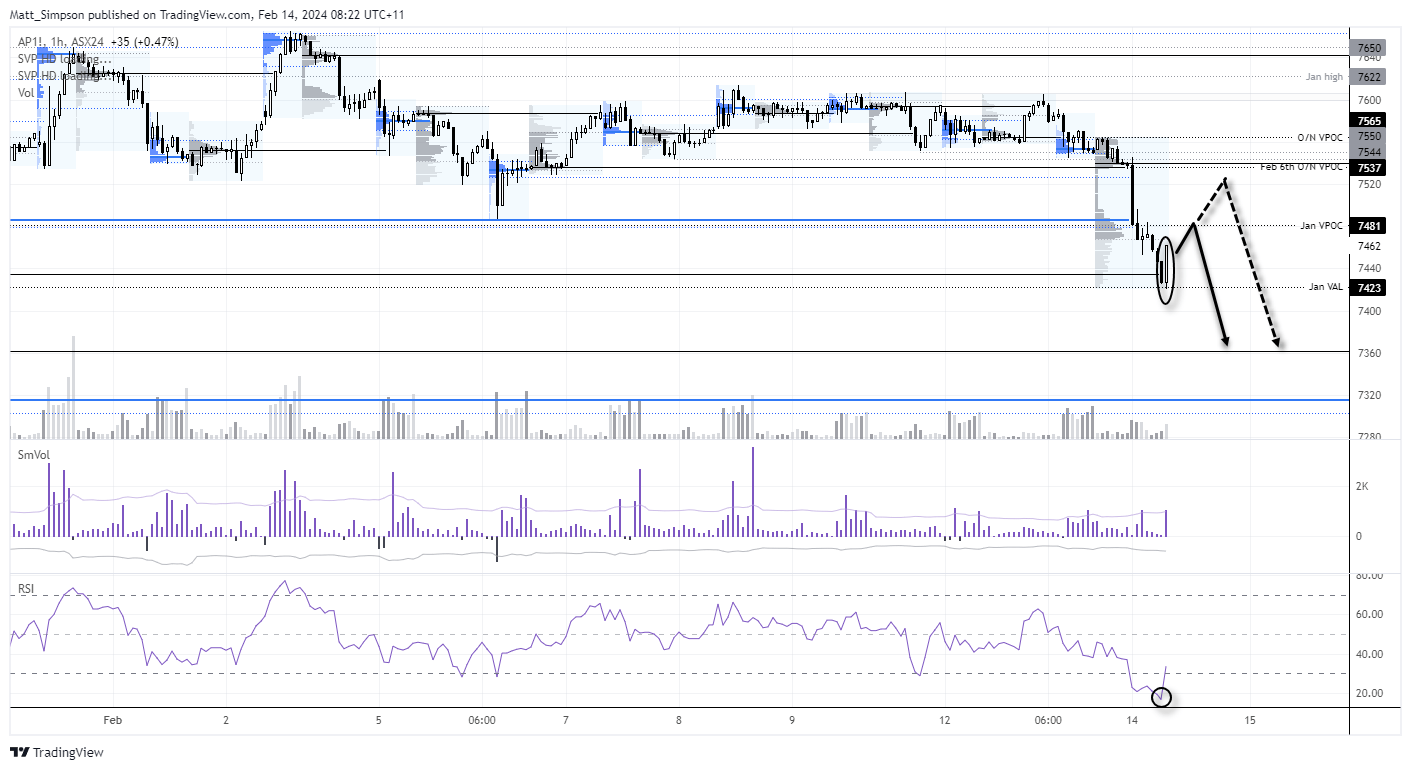
ASX 200 at a glance:
- The ASX 200 cash index turned lower for a second day ahead of the US CPI report, and we can rest assured it will gap lower today looking at overnight pricing
- The SPI 200 futures market fell -1.2% although it recouped some of those losses heading into the New York close
- Note tha bullish engulfing candle on ther last hour’s of trade on SPI futures whilst RSI (14) was oversold. The daily low also found support at the January VAL (value area low), so perhaps a bounce is due
- If we see a retracement higher, I’d prefer to look for swing highs around resistance in anticipation of of its next move to 7360 support.
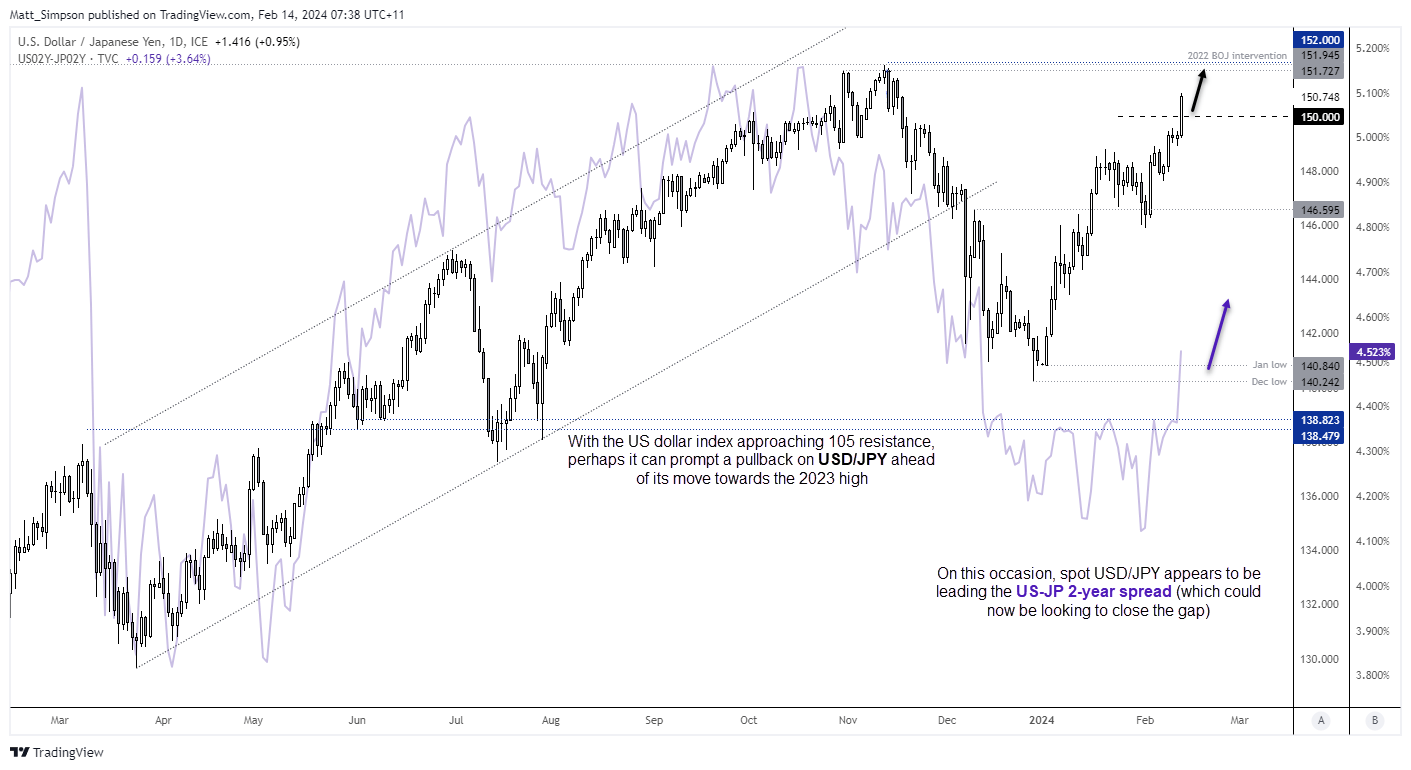
USD/JPY technical analysis (daily chart):
On this occasion, spot forex prices have been leading yield differentials. USD/JPY reached its highest level since November after the CPI report and the US-JP 2-year spread broke out of its basing pattern and is now trying to close its large gap with spot prices. Given the BOJ’s ultra-dovish stance and strong economic data from the US, a move to and break above the 2023 high seems plausible.
However, keep a close eye on how the US dollar index reacts around its 105 resistance cluster as it could prompt a consolidation around these highs, if not a pullback. But with 150 nearby on 150 to provide potential support, bulls have an area of interest to reload ahead of the anticipated move to the infamous BOJ intervention highs. And they key to markets successfully breaking above 152 are to perhaps not be seen to be weakening the yen too quickly for the BOJ or MOFs liking, as to avoid another intervention.
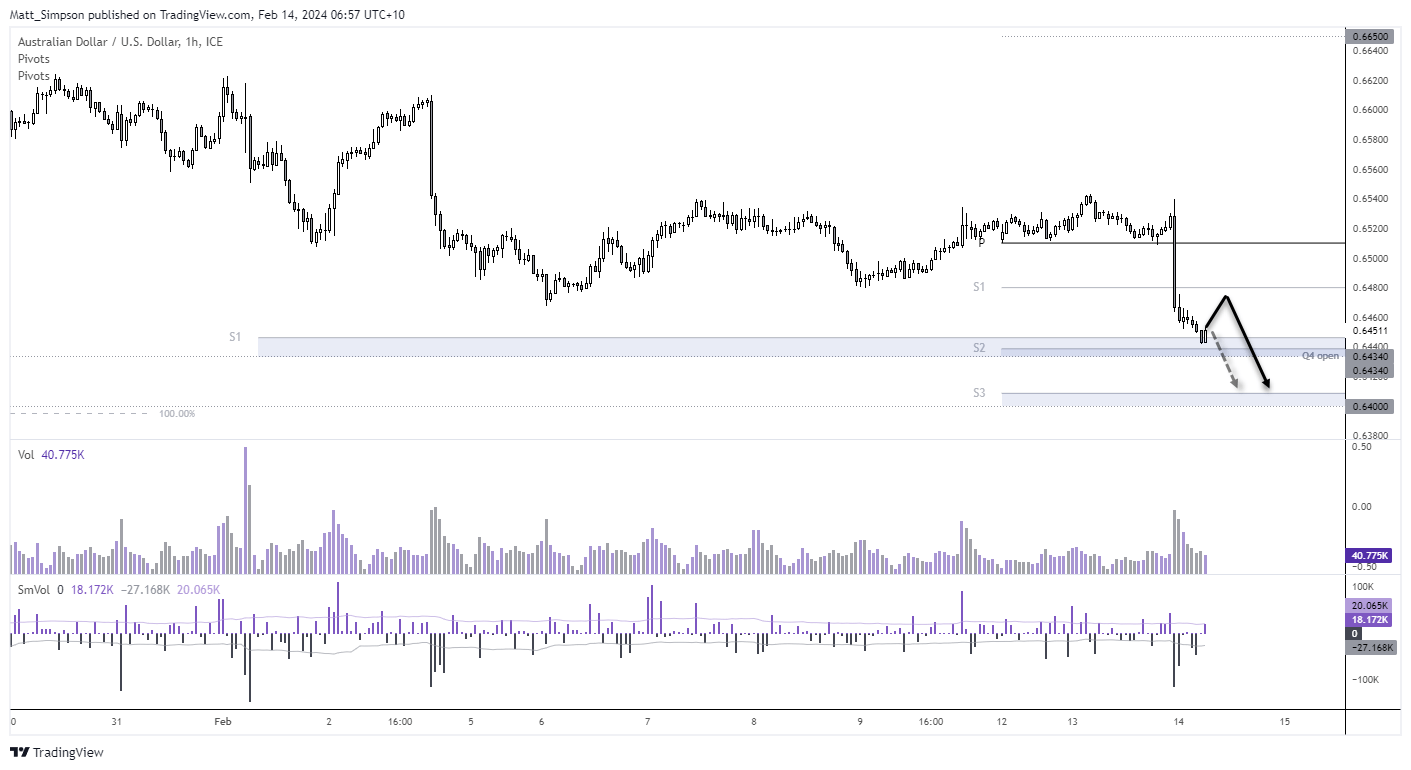
AUD/USD technical analysis (1-hour chart):
It seems that the bear-flag within the bear-flag I noted in the AUD outlook report is playing out nicely. The larger bear flag projects an approximate target around 63c, and the smaller one at 64c. Yet caution could be warranted around the cycle lows, given it is trying to form a base around the Q4 open, monthly S1 and weekly S2 pivots. Moreover, RSI 2 and 14 are oversold (not shown as to not clutter the chart).
From here, I would prefer to seek bearish setups at higher prices should evidence of a swing high form, using Tuesday’s low as an initial downside target – and running on the assumption of an eventual break beneath for a move to the smaller 64c bear-flag target.
View the full economic calendar
-- Written by Matt Simpson
Follow Matt on Twitter @cLeverEdge
How to trade with City Index
You can trade with City Index by following these four easy steps:
-
Open an account, or log in if you’re already a customer
• Open an account in the UK
• Open an account in Australia
• Open an account in Singapore
- Search for the market you want to trade in our award-winning platform
- Choose your position and size, and your stop and limit levels
- Place the trade
Latest market news
Yesterday 01:32 PM
Yesterday 09:35 AM
Yesterday 07:23 AM
Yesterday 04:48 AM
Yesterday 12:17 AM
July 25, 2024 10:39 PM
Latest Asian Open articles

July 25, 2024 10:39 PM

July 24, 2024 10:10 PM

July 23, 2024 11:29 PM

July 22, 2024 10:43 PM