


After bouncing off their worst levels, US stock markets are likely to resume lower following a big plunge in the aftermath of the FOMC’s fourth consecutive 75 basis point rate increase on Wednesday. We have seen more signs of weakening economic data today, which is not great for businesses and company earnings. In the past, the “bad news = good news for stocks” equation used to trigger a positive response in stock prices. But this no longer applies, because of the very high levels of inflation preventing the Fed from pivoting to a dovish stance. As Powell made it clear yesterday, the Fed expects to raise interest rates even higher than previously expected – because of inflation remaining stubbornly high and employment remaining strong.
While the Fed continues to remain very hawkish, a growing number of central banks are starting to pivot to a less hawkish stance.
A day after the Fed Chairman Jerome Powell warned that the terminal rate is going to be higher than previously anticipated, today saw the Bank of England deliver the opposite message, even if both central banks hikes rates by 75 basis points each. With the case of the latter, it is mainly concerns over stagflation than inflation alone. The BoE thinks that recessionary pressures are rising in the UK and around the world, which should help bring inflation lower eventually. In the case of the Fed, recession fears are not very high on the agenda at the moment, especially as employment remains very strong.
More US recession signals
But incoming economic data from the US continues to weaken, raising fears over an economic slowdown. The ISM Manufacturing PMI (50.2) barely grew as we found out on Monday, when we also had a poor Chicago PMI (45.3) reading. Today saw the ISM services PMI print 54.4 for October vs. 55.5 expected and 56.7 in September. Alarmingly, new export orders plunged, to 47.7 vs. 65.1 last month. This goes to show how bad the strong dollar is hurting US exports. Meanwhile, Factory Orders fell by 0.1% month-on-month, when a flat reading was expected.
These are not great economic indicators by any means, but at the same time the “bad news = good news for stocks” equation doesn’t necessarily apply, because of the very high levels of inflation preventing the Fed from pivoting to a dovish stance. As mentioned, the Fed expects to raise interest rates even higher than previously expected.
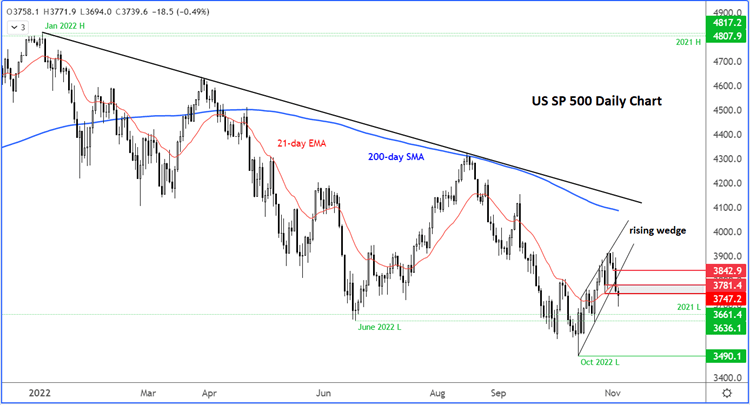
S&P breaks out of wedge
Thanks to the hawkish Fed and weak macro data, the S&P has broken out of a rising wedge pattern. Despite its name, this is meant to be a bearish continuation pattern. When the market breaks the support trend line, the longer-term bearish trend tends to resume. The S&P has also broken below last Friday’s big bullish candle, thus taking out some of the bulls who had placed their stops below the low of that day’s candle.
With the 3747-3781 support area now broken, this is going to be the area to defend for the bears now. For as long as the index holds below here, the path of least resistance would remain to the downside. The next downside target it is last year’s low at 3661, followed by the reclaimed June low at 3636. If the latter breaks, then a revisit of the October low at 3490 would become highly likely in my view.
How to trade with City Index
You can trade with City Index by following these four easy steps:
-
Open an account, or log in if you’re already a customer
• Open an account in the UK
• Open an account in Australia
• Open an account in Singapore
- Search for the company you want to trade in our award-winning platform
- Choose your position and size, and your stop and limit levels
- Place the trade
Latest market news
Yesterday 01:32 PM
Yesterday 09:35 AM
Yesterday 07:23 AM
Yesterday 04:48 AM
Yesterday 12:17 AM
July 25, 2024 10:39 PM
Latest US 500 articles

July 25, 2024 01:30 PM

July 18, 2024 11:14 PM

July 18, 2024 11:35 AM

June 13, 2024 02:00 PM