


S&P 500 hits record high, futures hint at break above 5,000
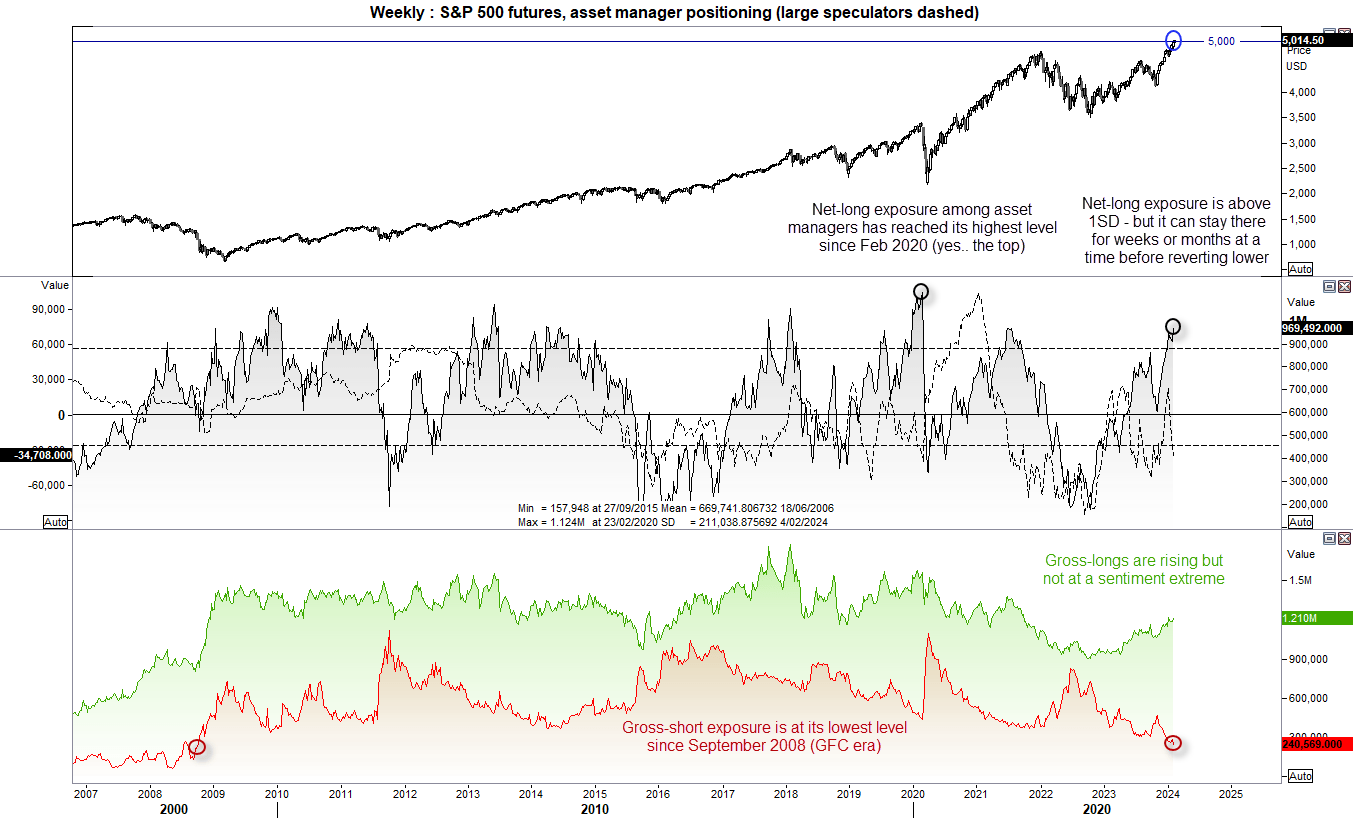
The S&P 500 reached a fresh record high and stopped just 5 points short of the 5,000 milestone thanks to strong earnings. Whilst the S&P 500 cash market stopped just shy of the 5k milestone, S&P futures managed to close just above it. And asset managers have backed this rally all of the way looking at futures positioning.
Last week, net-long exposure to S&P 500 futures rose to its most bullish level since February 2020 last week (yes, the pre-pandemic high…). This may seem ominous given this marked the market top as the global pandemic took hold, but it is also up for debate as to whether net-long exposure has risen to a sentiment extreme.
Sure, at +969.5k contracts net long it is well above its long-term average of 669.7k and above +1 standard deviation from its mean. But it has spent several months above +1 SD in the past. Furthermore, gross-long exposure is not at a sentiment extreme – although it is worth noting that gross-short exposure has fallen to its lowest level since September 2008 (pre-GFC era)
But until we see bears stepping into the ring or a prominent reversal pattern form, we could assume the trend is set to resume. Especially if headlines of ‘S&P 5k’ spur another round of buying from late newcomers. And perhaps that will be the phase ahead of a decent pullback.
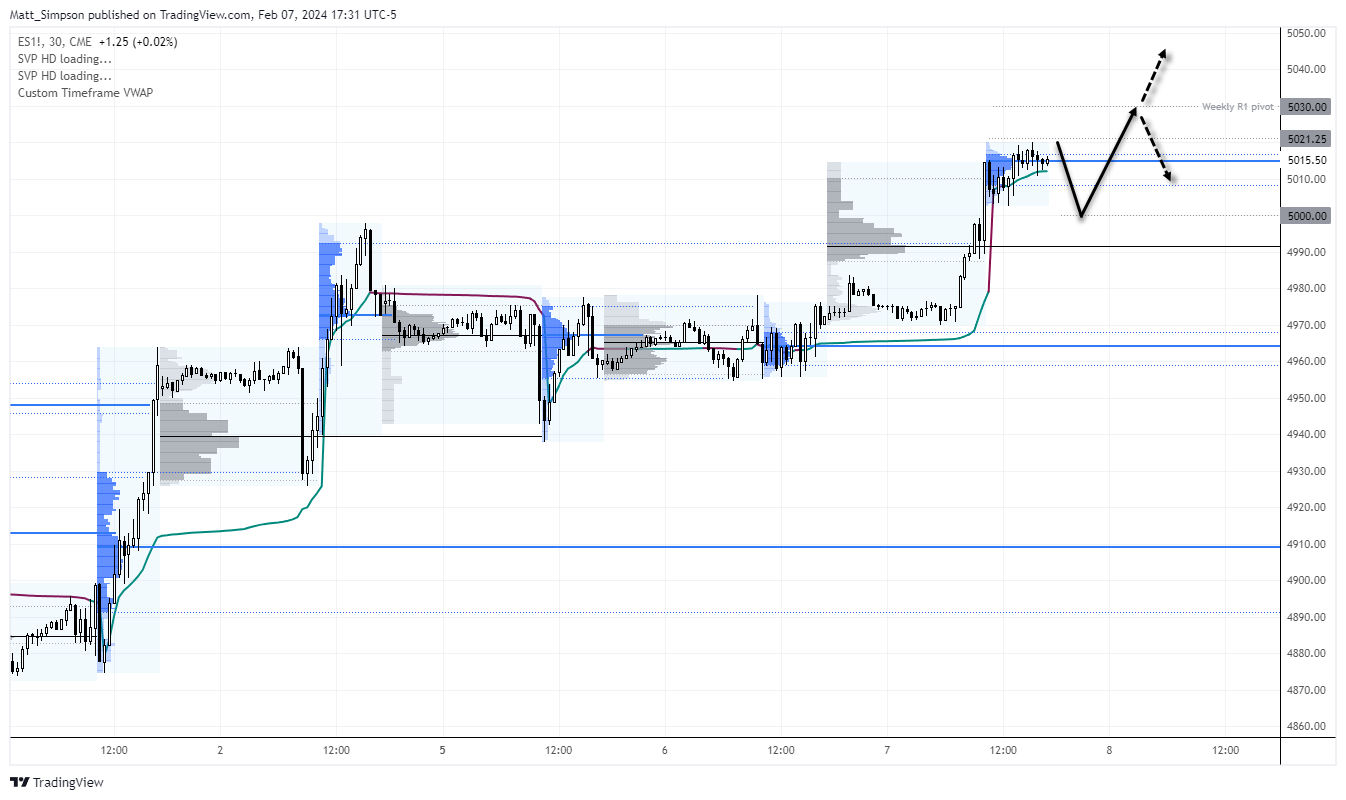
S&P 500 futures technical analysis (30-minute chart):
The 30-minute chart shows that S&P 500 futures are trading within a tight consolidation just off its record high. Volumes will be much lower during Asia, and perhaps that will allow the market to drift lower towards 5008 or 5000 support. I would be suspicious of any ruins to new highs during Asia, and would prefer to wait to see if prices reverted back beneath the record high before considering a counter-trend short.
But given the strength of the rally into these highs, the core bias is to seek evidence of swing lows around support levels for a long. Take note that the weekly R1 pivot sits around 4030 which makes it a viable target for bulls.
Market Summary:
- Performance was mixed across the FX majors on Wednesday with the US dollar and euro in the middle of the pack regarding strength, whilst CHF was the weakest forex major, GBO and CAD were the strongest
- The US dollar index retraced for a second day as EUR/USD tapped a 3-day high, but as outlined in yesterday’s FX major report I suspect EUR/USD will eventually break beneath 1.07 given the strength of the fall into the December lows compared with the 2-day ‘rally’ from it.
- A small shooting star candle formed on AUD/USD to warn that its rebound back above 65c is already running low on fuel, however the 30-min chart show potential support around 0.6515 so perhaps it can produce a swing higher in today’s Asian session
- Crude oil prices rose for a second day in line with Monday’s bullish bias. As noted yesterday. the 30-minute chart remains choppy to suggest the move higher is corrective, but for now buyers are stepping in around swing lows and the target to the $74.50-80 area remains intact. \
- Gold remains choppy as predicted, with Tuesday’s bullish inside day being followed by a small inverted hammer candle (flat close with a tall upper wick).

Events in focus (AEDT):
- 09:00 – Australian
- 10:50 – Japan’s
- 11:30 – Australian building approvals
- 12:30 – China CPI, PPI
- 13:00 – New Zealand inflation expectations
- 00:30 – US jobless claims
- 01:00 – BOE MPC member Dhingra speaks
- 01:15 – ECB member Elderson speaks
- 02:00 – VOE MPC member Mann speaks
- 02:30 – ECB lane speaks
- 04:05 – FOMC member Barkin speaks
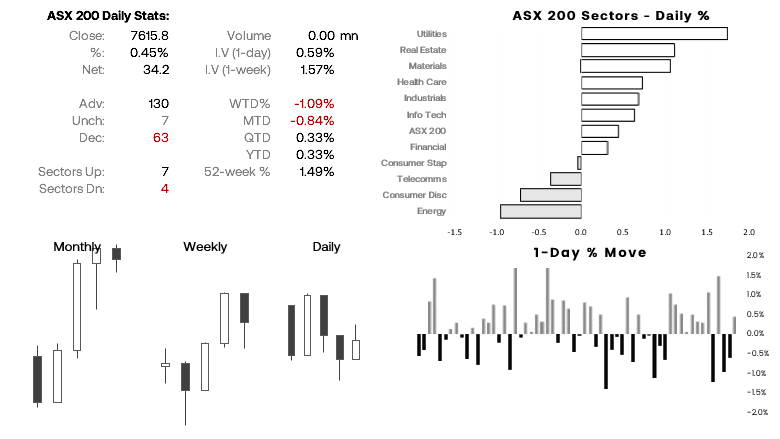
ASX 200 at a glance:
- The ASX 200 snapped a 2-day losing streak after it fell from its record high ~7700
- Support was found above the 2023 high at 7567.7, and it remains a key level of support today (along with yesterday’s low of 7581.6
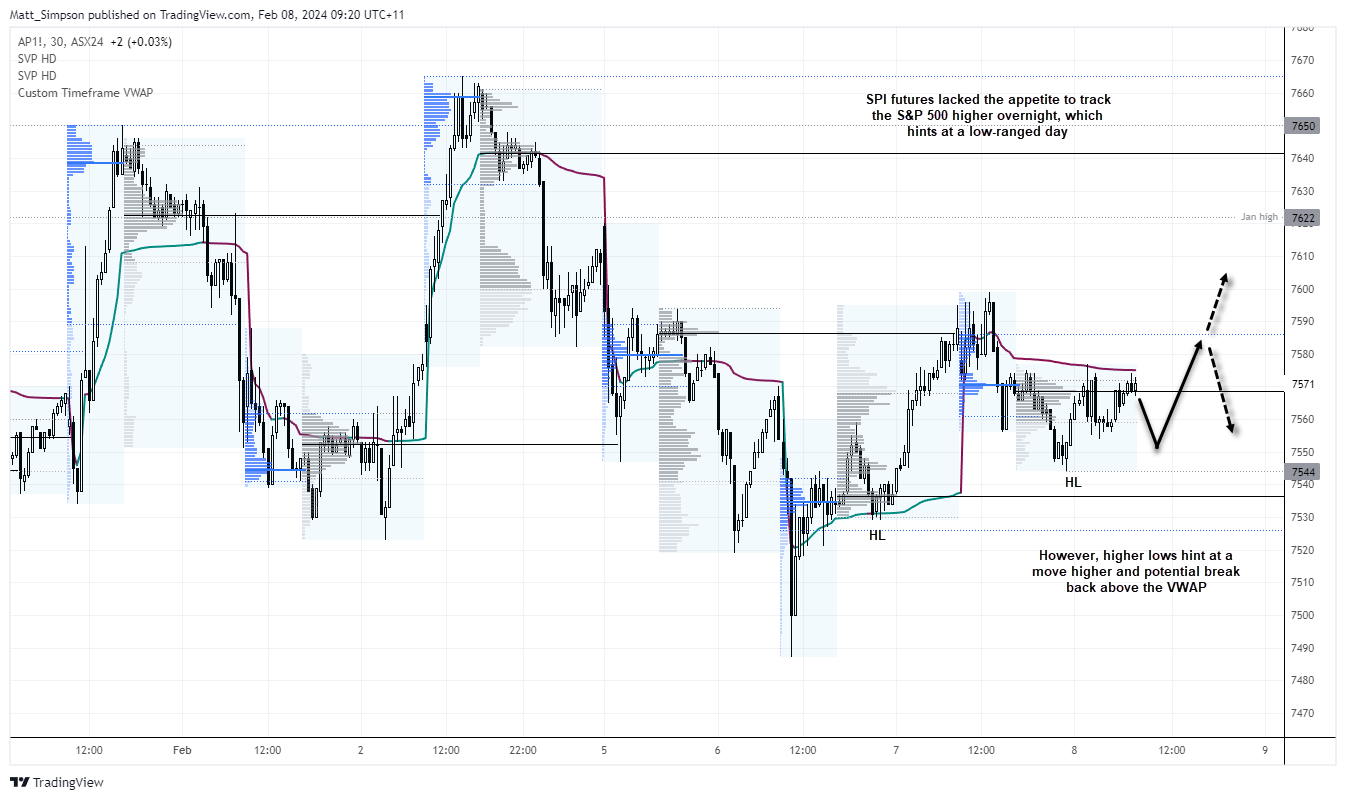
- SPI futures recovered their overnight losses after US markets opened, but it seems as though thhey didn’t have the appetite to track the S&P 500 higher as it reached a record high
- Note that SPI futures remained beneath the VWAP overnight, so perhaps prices will pull back today.
- But as long as they hold above the 7544 low, the bias is for another leg higher
View the full economic calendar
-- Written by Matt Simpson
Follow Matt on Twitter @cLeverEdge
How to trade with City Index
You can trade with City Index by following these four easy steps:
-
Open an account, or log in if you’re already a customer
• Open an account in the UK
• Open an account in Australia
• Open an account in Singapore
- Search for the market you want to trade in our award-winning platform
- Choose your position and size, and your stop and limit levels
- Place the trade
Latest market news
Yesterday 01:32 PM
Yesterday 09:35 AM
Yesterday 07:23 AM
Yesterday 04:48 AM
Yesterday 12:17 AM
July 25, 2024 10:39 PM
Latest Asian Open articles

July 25, 2024 10:39 PM

July 24, 2024 10:10 PM

July 23, 2024 11:29 PM

July 22, 2024 10:43 PM