


- Japan's Nikkei 225 has surged to the highest level since 1990
- After its textbook technical break last week, the index is overbought on RSI across most timeframes
- USD/JPY downside risks appear elevated as yield differentials between the US and Japan compress
It’s little wonder so many investors are rushing to buy Japan’s Nikkei 225 following its textbook breakout to fresh 34-year-highs last week. With a weaker Japanese yen juicing corporate earnings for exporters, corporate governance reforms aiming to boost shareholder returns and investors using the index as a way to obtain exposure to China without investing in China, the added boost provided by favourable technicals has generated another powerful tailwind for Japanese stocks.
While you can’t argue with the recent price action – sentiment is off the charts – there are some obvious downside risks that come across as underpriced right now.Nikkei RSI reading warns of near-term reversal risk
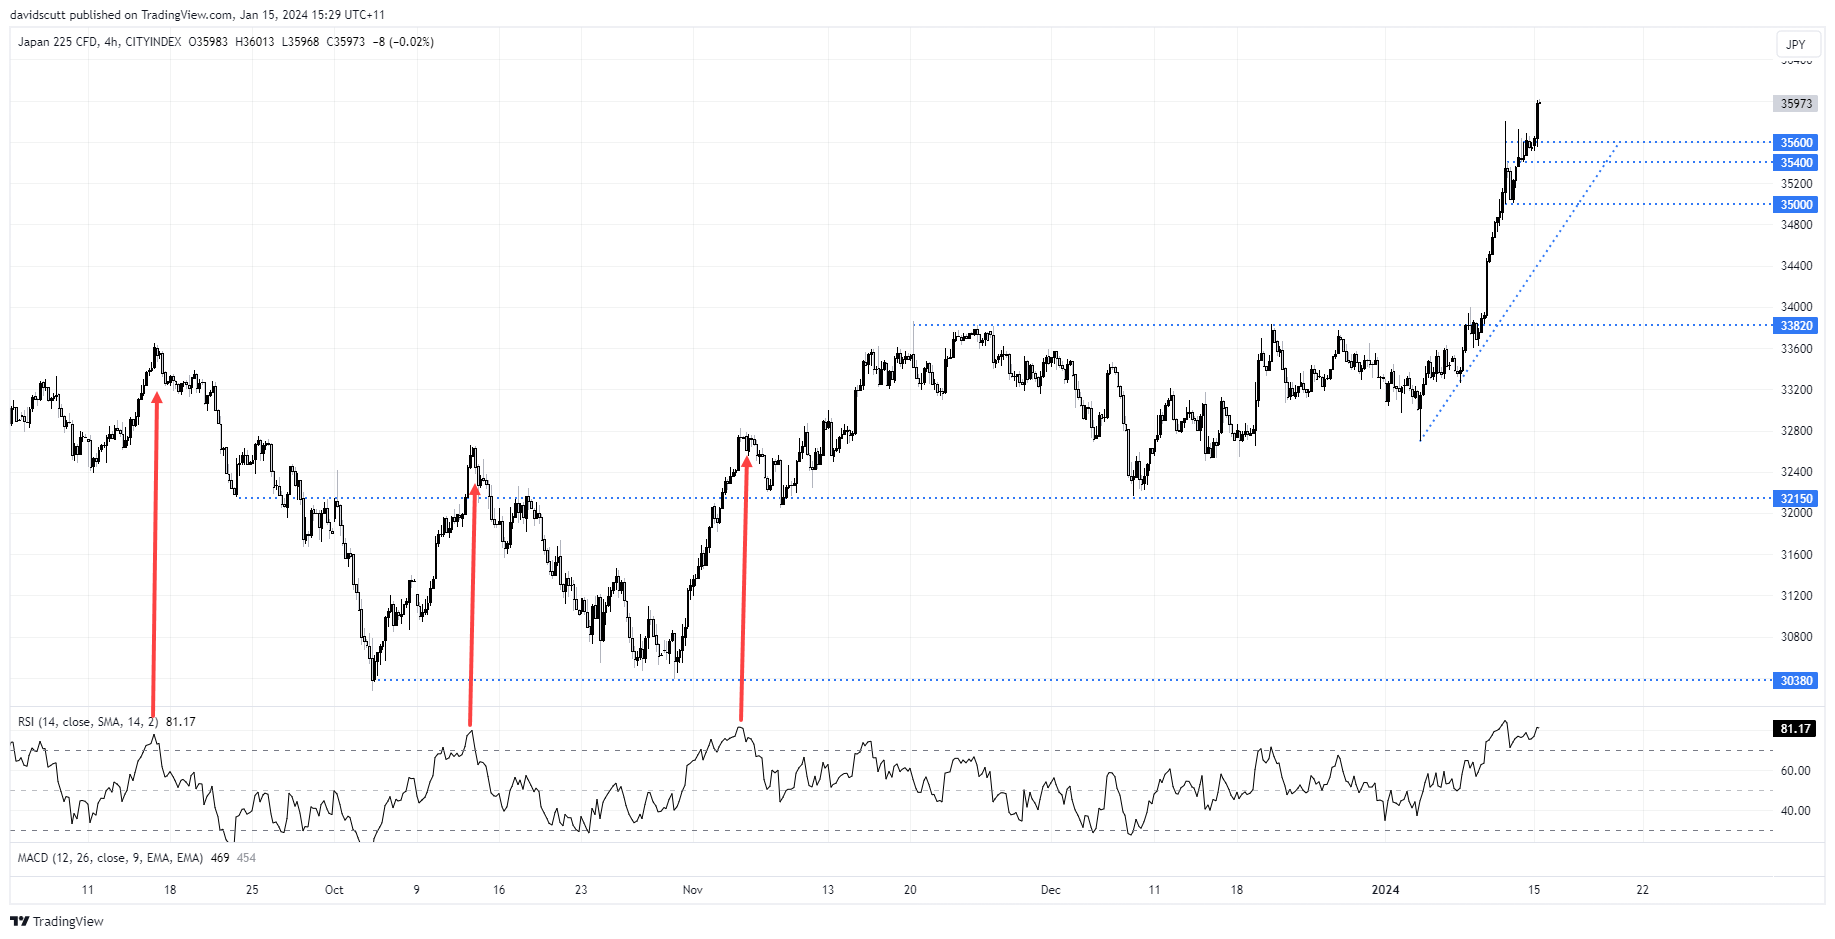
Regardless of what chart you’re watching, the Nikkei is overbought on RSI on every timeframe up to monthly, underlining just how abrupt the move has been recently. Shorter timeframes are especially overbought, sitting in the 80s.
Whenever the Nikkei has been this overbought on the four-hourly going back to September, it’s often marked a near-term top. Some pullbacks have been small, some more significant. While a RSI this high doesn’t guarantee a similar outcome, it is a warning that the index is already looking over loved.
2-Year US-Japan yield spread collapses to lows not seen since May
As for the potential catalysts that could drive a meaningful reversal, it’s difficult to go past narrowing yield differentials between the United States and Japan, potentially creating downside risks for USD/JPY and tailwinds for Japanese exporter earnings.
Following last Friday’s weak US producer price inflation report for December, markets ramped up rate cut expectations for the Federal Reserve with nearly 170 basis points worth of easing now priced in this year, seeing the yield advantage the US enjoys of Japanese bonds over a two-year tenor compress to the lowest level since May 2023. US-Japan spreads over longer timeframes have also compressed towards recent lows, as seen in the chart below tracking 5-year spreads, shown in black, versus movements in USD/JPY.
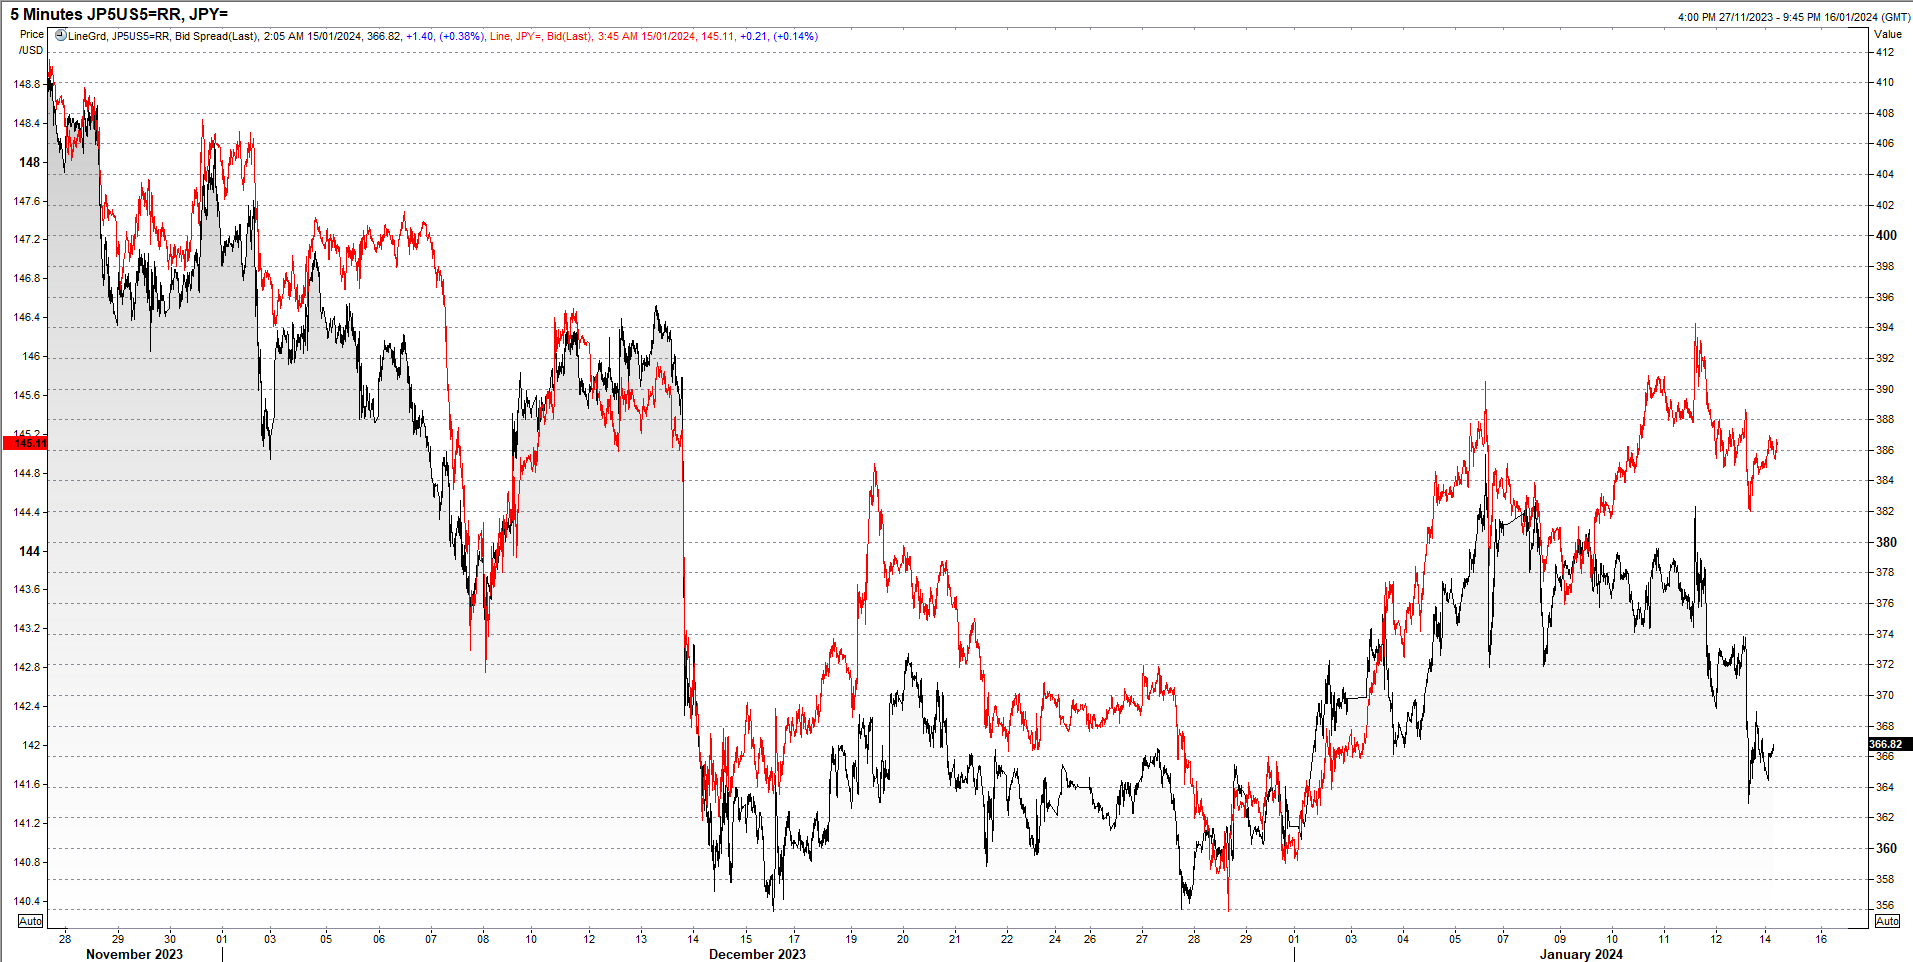
Source: Refinitiv
Whereas USD/JPY would normally weaken in line with spread differentials, the sensitivity has not been there recently. Part may be due to capital flows into Japanese markets, not only for equities but also bonds which have rallied as speculation over a preemptive move from the Bank of Japan to normalise monetary policy settings has faded.
But with most other US economic data holding up – especially the jobs market –increasingly large Fed rate cut bets are allowing the soft landing narrative to flourish, helping an index like the Nikkei given its cyclical attributes.
Looking at the calendar this week, there’s very little on the US data docket that could meaningfully shift the soft landing narrative, especially on a one-month basis. But there are plenty of Fed speakers ahead of the FOMC’s January meeting blackout next week, including influential former policy hawk Governor Christopher Waller on Tuesday.
Given he first gave oxygen to limited Fed rate cut bets last November by publicly discussing the potential for easing to begin sooner than originally indicated, sowing the seeds for the broader Fed policy pivot in December, it’s likely his speech will attract plenty of market attention.
Will he give a nod to the rapid build in easing expectations or pushback, and if the latter, how aggressively? While markets may choose to ignore any attempt to shift pricing, Waller has proven he can move the dial when he wants. For yield spreads and soft landing narrative, this is a big event, potentially the most important of the week.
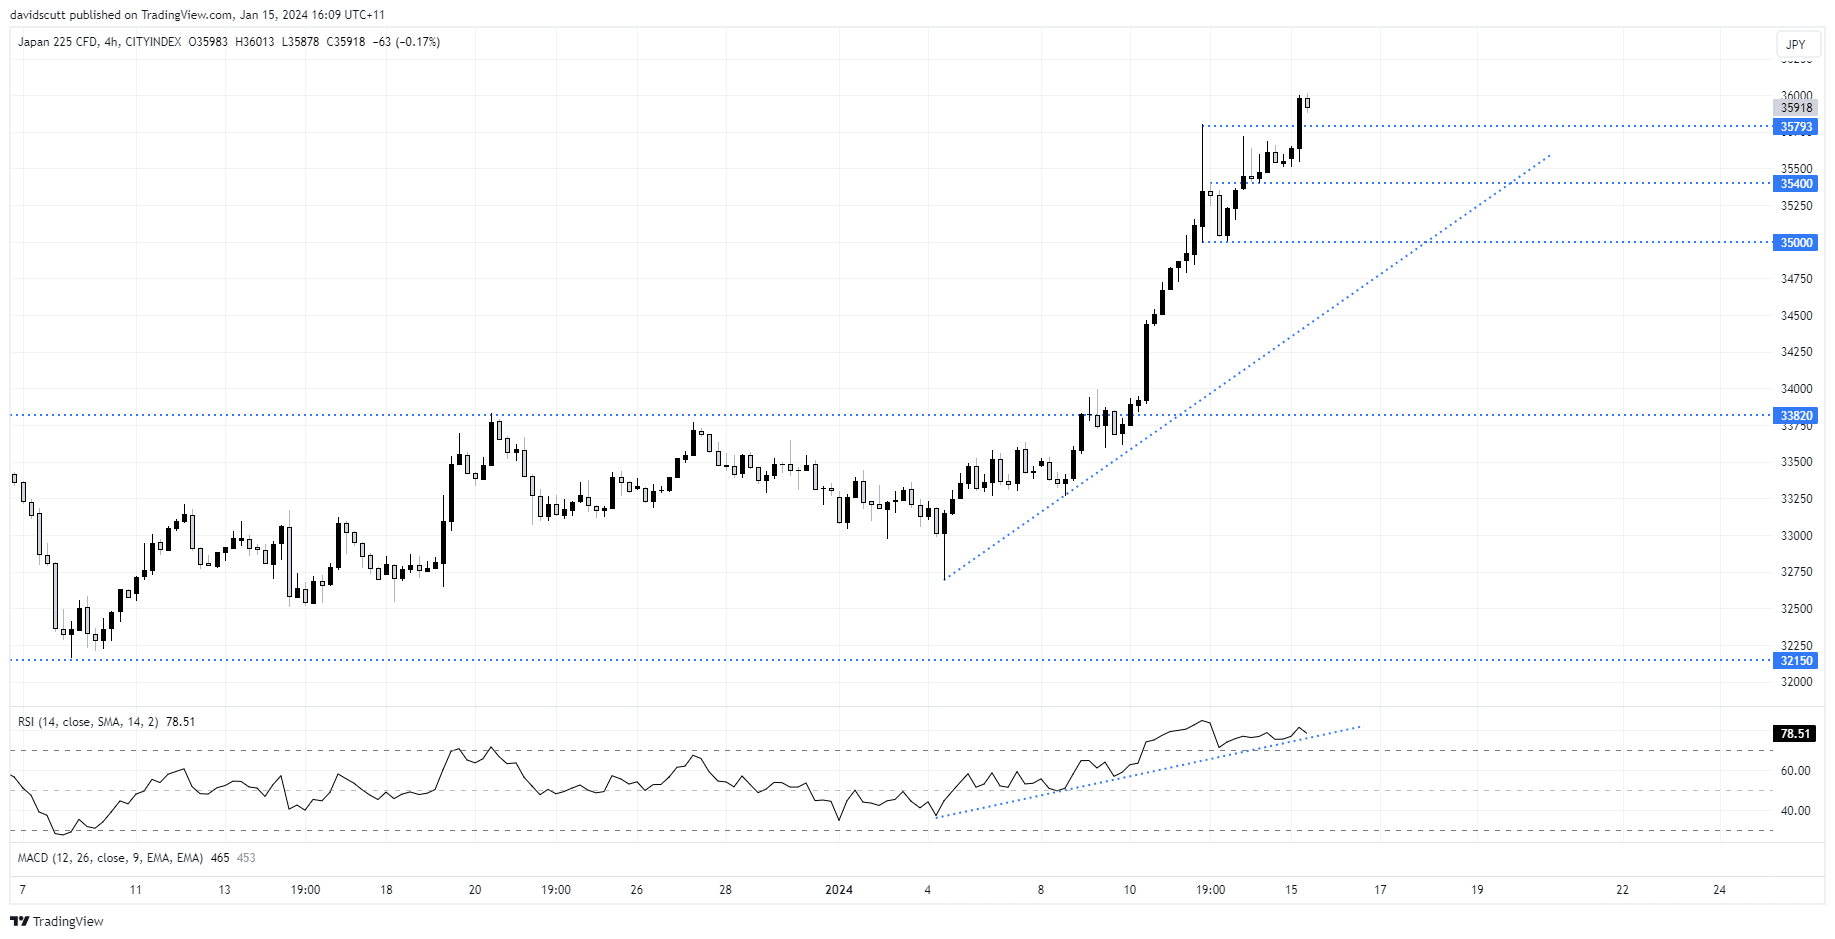
Nikkei stalls at 36000… for now
For the Nikkei, support is located at 35800, 35400 and 35000. 36000 has provided some resistance against the tide on Monday.
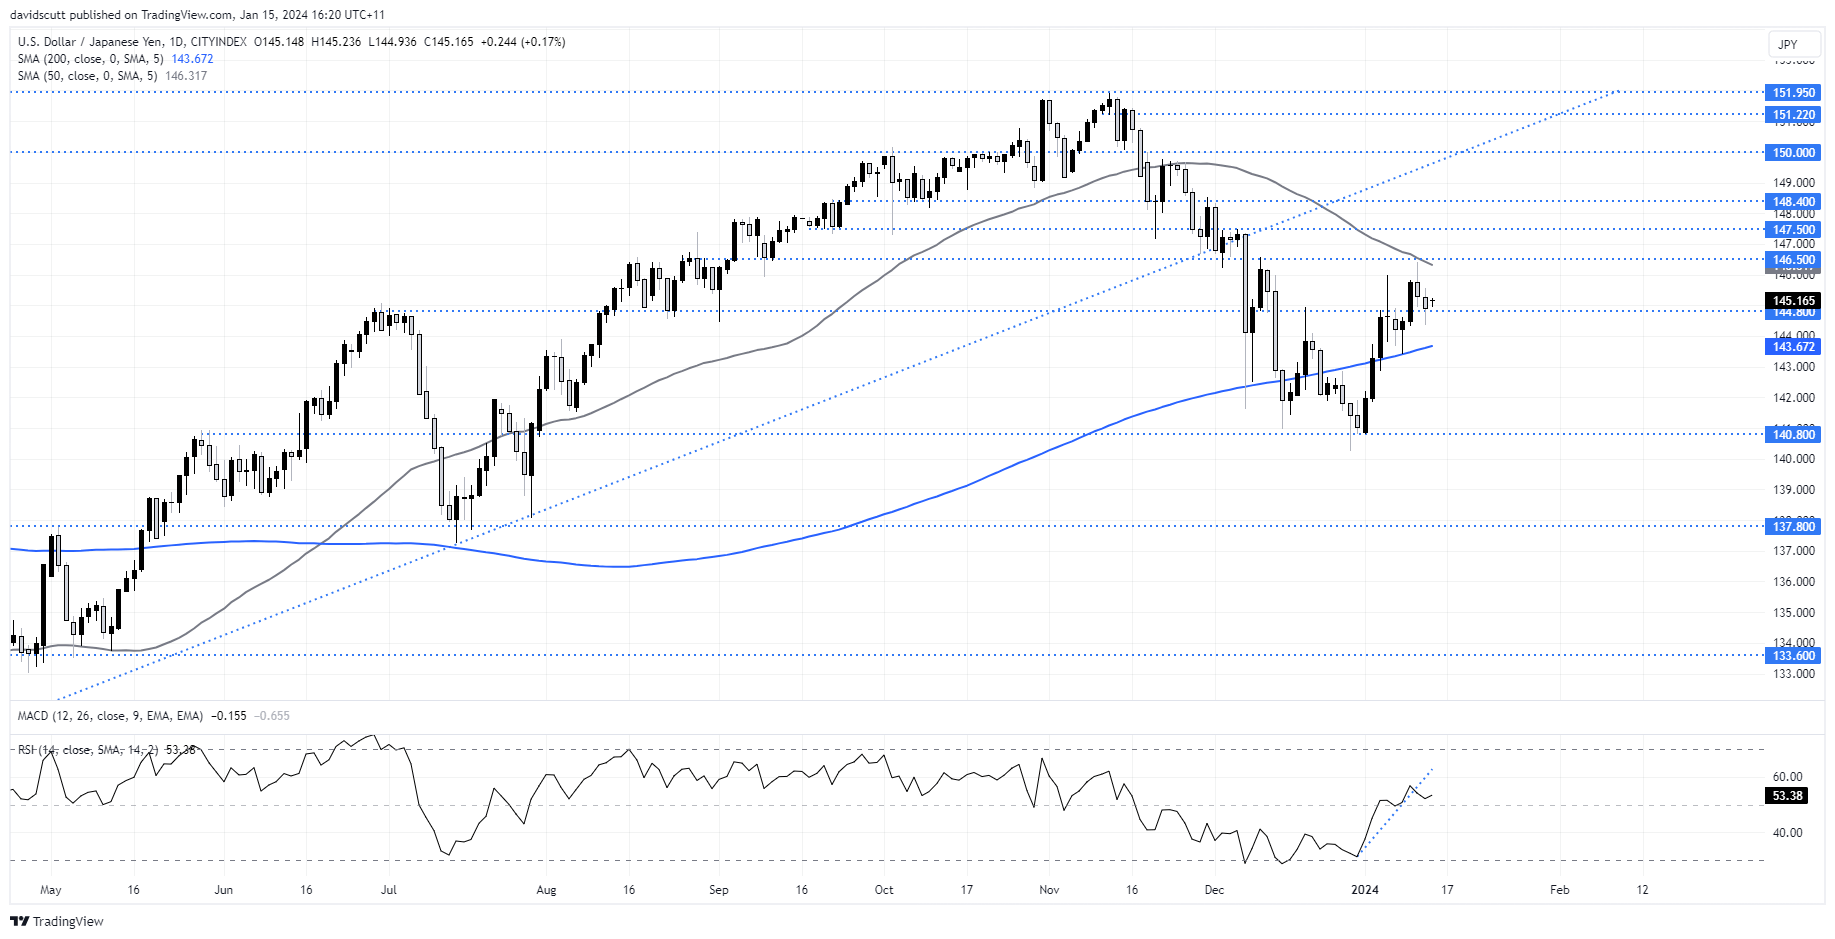
USD/JPY stuck between major moving averages
As for USD/JPY, the daily shows the pair sandwiched between the 50 and 200-day moving averages at 146.30 and 143.67 respectively. Based on rate differentials and uptrend break of RSI on the daily chart, risks appear skewed to the downside.
Written by David Scutt
Follow David on Twitter @scutty
How to trade with City Index
You can trade with City Index by following these four easy steps:
-
Open an account, or log in if you’re already a customer
• Open an account in the UK
• Open an account in Australia
• Open an account in Singapore
- Search for the market you want to trade in our award-winning platform
- Choose your position and size, and your stop and limit levels
- Place the trade
Latest market news
Yesterday 01:32 PM
Yesterday 09:35 AM
Yesterday 07:23 AM
Yesterday 04:48 AM
Yesterday 12:17 AM
July 25, 2024 10:39 PM
Latest Japan 225 articles

June 3, 2024 05:56 AM

May 29, 2024 06:30 AM
April 17, 2024 11:48 PM

February 28, 2024 04:40 AM