


If we take a step back to admire the view, the Nasdaq 100 appears defiantly bullish with the clout of net-long asset managers fully behind it. Yet with so many headline risks, earnings season, and Fed members speaking this week, it could struggle to break a key resistance over the near term if geopolitical risks intensify amid calls of 'higher for longer' interest rates.
- The Nasdaq displays a strong bullish trend on the weekly chart
- Yet it trades within a consolidation on the weekly chart that could move sharply lower and still retain its bullish trend
- Market positioning among asset managers remains firmly bullish, and perhaps too bullish given headline risks
- The Middle East conflict, higher for longer rates and calls for a recession could weigh on sentiment
- The daily chart has hit clear resistance levels that it might struggle to break above in the near-term
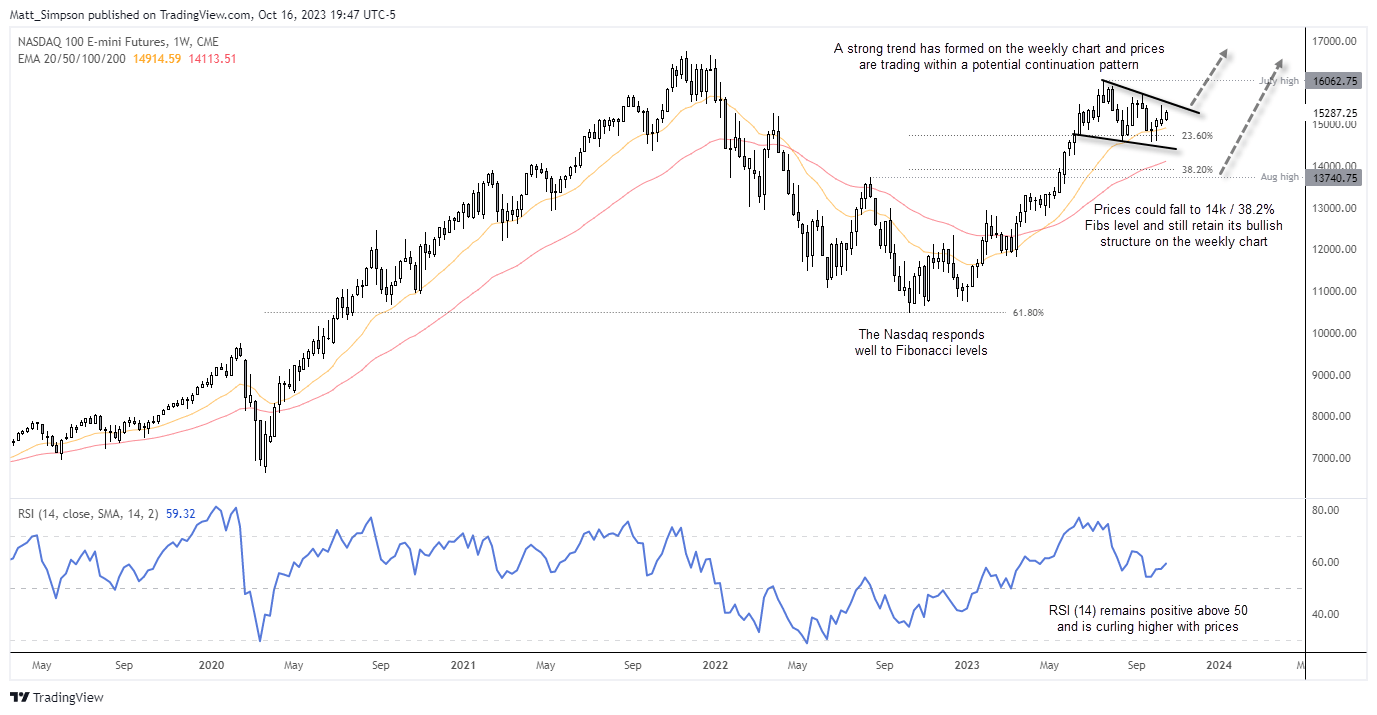
Nasdaq 100 technical analysis (weekly chart):
The Nasdaq’s weekly trend structure is very bullish, with a clear impulsive leg higher from the 2022 low with shallow retracements. The weekly RSI (14) remains positive above 50 and has recently curled higher with prices, and prices are holding above the 10-week EMA.
The Nasdaq has also responded well with Fibonacci levels on the weekly chart, with its retracement from its all-time high to the 2022 low stalling around a 61.8% Fibonacci retracement and the current retracement holding above the 23.6%.
With that said, a bullish divergence has not formed to warn the end of the correction could be near, and prices could fall back the 14,000 or the August high and retain its bullish trend. And market positioning also has me a little wary that perhaps asset managers have been too bullish for too long on Nasdaq futures.
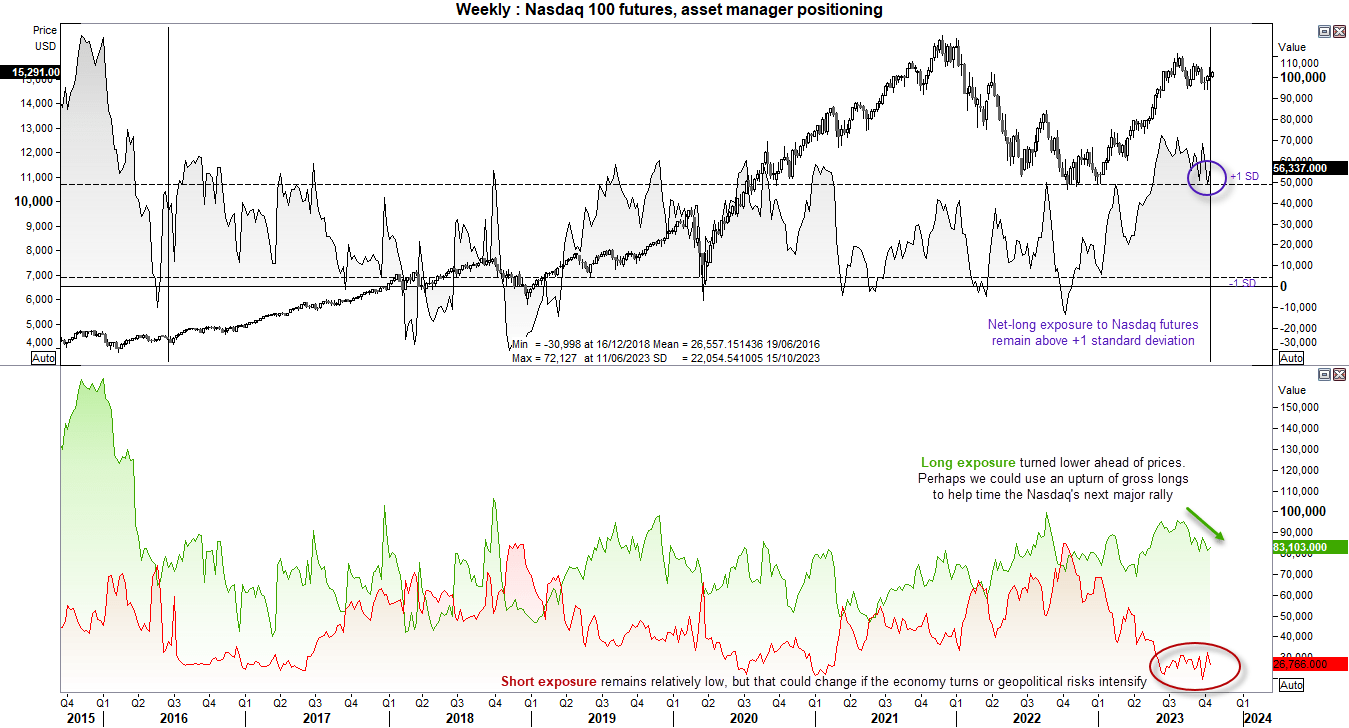
Nasdaq 100 market positioning
Asset managers remain heavily long Nasdaq 100 futures according to the commitment of traders report (COT). Net-long exposure has remained above +1 standard deviation since May using data from 2016 to warn of a sentiment extreme. I used 2016 as the starting point of the calculation before prior to 20165 showed much higher levels of open interest and therefore a higher level of net-long exposure.
Gross longs moved lower ahead of the Nasdaq 100 top, so perhaps we could use a rise of gross longs in future to help time the Nasdaq’s next major rally. Gross shorts remain relatively low, but in the event of an economic downturn or black swan event, I’d expect shorts to pick up very quickly and weigh on the Nasdaq.
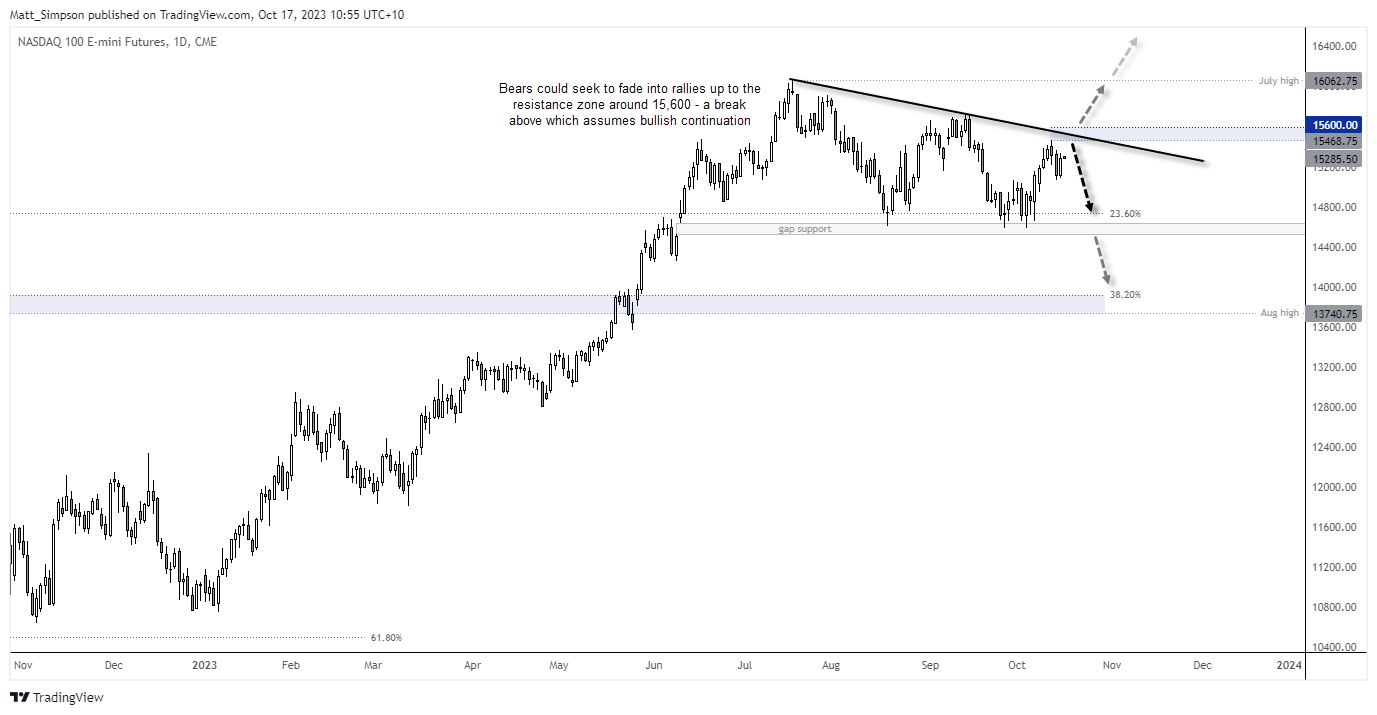
Nasdaq 100 technical analysis (daily chart):
The daily chart shows that the market has been oscillating since the July high, although each decline has found support around the June 8 opening gap. Three lower highs have formed on the daily chart and prices remain beneath the a retracement line, and unless we see widespread risk-on for global markets then we favour another leg lower on the daily chart.
- Bears could seek to fade into minor rallies beneath last week’s high / the bearish trendline with a stop loss above the 15,600 handle
- Initial target could be the 14,800 handle or gap support
- Widespread risk-off could assume a break to new lows and for prices to head towards 14,000 / 38.2% Fibonacci level
- A clear break above 15,600 assumes bullish continuation and for a move to 16,000 / July high
-- Written by Matt Simpson
Follow Matt on Twitter @cLeverEdge
How to trade with City Index
You can trade with City Index by following these four easy steps:
-
Open an account, or log in if you’re already a customer
• Open an account in the UK
• Open an account in Australia
• Open an account in Singapore
- Search for the market you want to trade in our award-winning platform
- Choose your position and size, and your stop and limit levels
- Place the trade
Latest market news
Today 11:05 AM
Today 10:46 AM
Today 05:56 AM
Yesterday 11:57 PM
Latest Trade Ideas articles

Today 11:05 AM

Today 05:56 AM

Yesterday 11:57 PM
April 26, 2024 11:40 AM