


We tend to focus on shorter-term performance and trends in our articles, but sometimes it pays to take a step back and look at returns over a longer-term perspective. Going back ten years, here are the annual (price-only, no dividends included) returns of the Nasdaq 100 index (US Tech 100):
- 2012: +18.1%
- 2013: +36.6%
- 2014: +19.1%
- 2015: +9.5%
- 2016: +7.0%
- 2017: +32.7%
- 2018: -0.1%
- 2019: +39.1%
- 2020: +48.6% (!!)
- 2021: +27.2%
All told, the tech-focused Nasdaq 100 has returned an average of 22.5% annually over the last ten years, compared with “just” 14.7% for the broader S&P 500 index, which has had quite an impressive decade of its own.
Against that backdrop of relentless gains, it’s not surprising that Nasdaq 100 bulls may have grown somewhat complacent. Perhaps that’s why the ugly -7% drop to start 2022 has bulls feeling so uneasy. As the chart below shows, this is the first time since the pandemic began that the index has broken conclusively below its 100-day EMA, and the widely-watched 200-day EMA near 15,000 has now come under pressure:
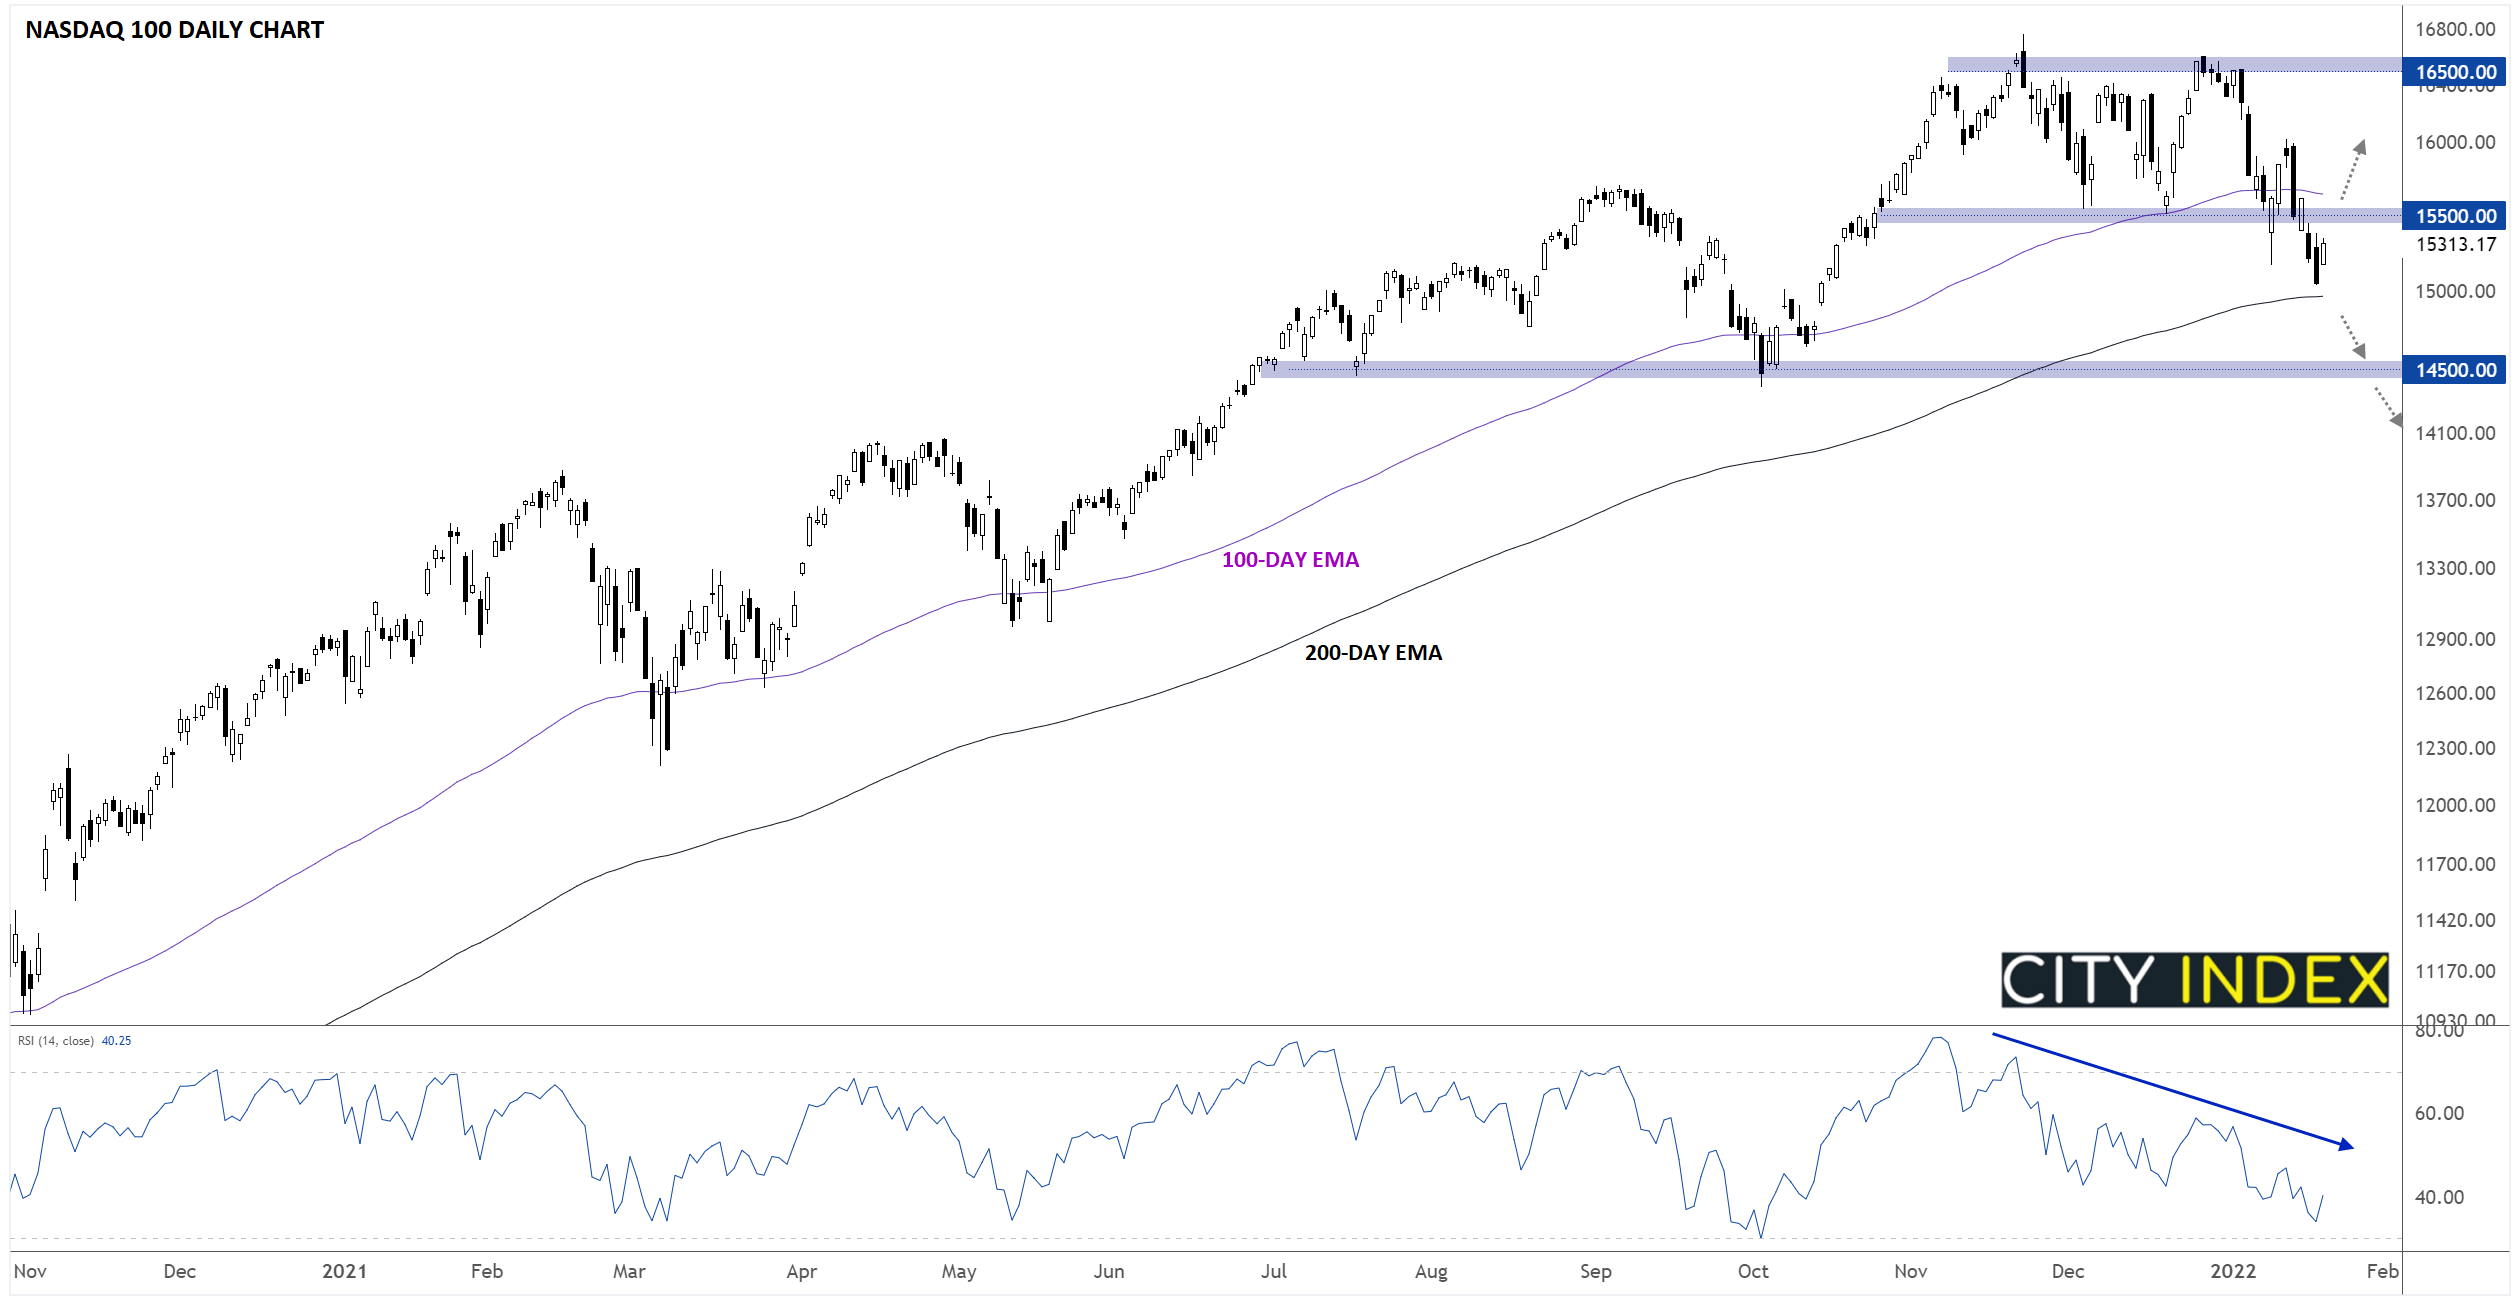
Source: TradingView, StoneX
See my colleague Josh Warner’s report on Big Tech stocks as part of 2022 Market Outlook!
From a technical perspective, the index remains in a long-term uptrend, and any trader who’s tried to bet against that trend over the last decade has quickly been proven wrong. That said, this dip in the Nasdaq 100 comes at a particularly precarious time; after all, the massive technology stocks that make up a full 45% of its market cap report earnings in the next two weeks:
- January 25: Microsoft (9.9%)
- January 26: Tesla (4.3% weight)
- January 27: Apple (11.8%)
- February 1(?): Amazon.com (6.9%)
- February 1: Alphabet / Google (7.2%)
- February 2: Meta Platforms / Facebook (4.9%)
One way or another, the outlook for the Nasdaq 100 will be much clearer in two weeks. If investors react positively to these behemoths’ earnings and the Nasdaq 100 holds above its 200-day EMA in the 15,000 area, the longer-term uptrend will likely reassert itself. Alternatively, soft earnings reports and/or guidance, confirmed by a break below 15,000, would see the index get off to one of its worst starts in over a decade.
How to trade with City Index
You can trade with City Index by following these four easy steps:
-
Open an account, or log in if you’re already a customer
• Open an account in the UK
• Open an account in Australia
• Open an account in Singapore
- Search for the company you want to trade in our award-winning platform
- Choose your position and size, and your stop and limit levels
- Place the trade
Latest market news
Yesterday 01:32 PM
Yesterday 09:35 AM
Yesterday 07:23 AM
Yesterday 04:48 AM
Yesterday 12:17 AM
July 25, 2024 10:39 PM
Latest Nasdaq articles

Yesterday 01:32 PM

July 25, 2024 01:17 PM

July 25, 2024 01:01 AM

July 23, 2024 01:38 PM