


Nasdaq 100 takeaways
- Following the “calm before the (earnings) storm,” volatility in the Nasdaq 100 should pick up by mid-week.
- The macroeconomic outlook remains solid, keeping the Fed on track to hike rates once more in two weeks.
- The bullish flag pattern over the last month points to a potentially strong bullish continuation if the index can break above 13,200.
With Q1 earnings season kicking off in earnest this week, we’re at the end of the proverbial “calm before the storm” for the Nasdaq 100. Two of the higher-weighted stocks in the index, Netflix (tomorrow) and Tesla (Wednesday) will report in the next 48 hours, with other heavy hitters like Microsoft, Alphabet, Amazon, and Meta on tap for next week and Apple hitting the wires on May 4th.
From a macroeconomic perspective, the US economy is holding up relatively well, with clear evidence that inflation is falling, the economy continues to grow at a solid rate, and the labor market still historically robust, despite some recent signs of softening. At this point, the biggest concerns for index investors are around a potential contraction in bank lending (especially at smaller regional banks) and the persistent inversion of the yield curve, an historically reliable recession indicator that is suggesting the Federal Reserve may have to start cutting interest rates in the second half of the year.
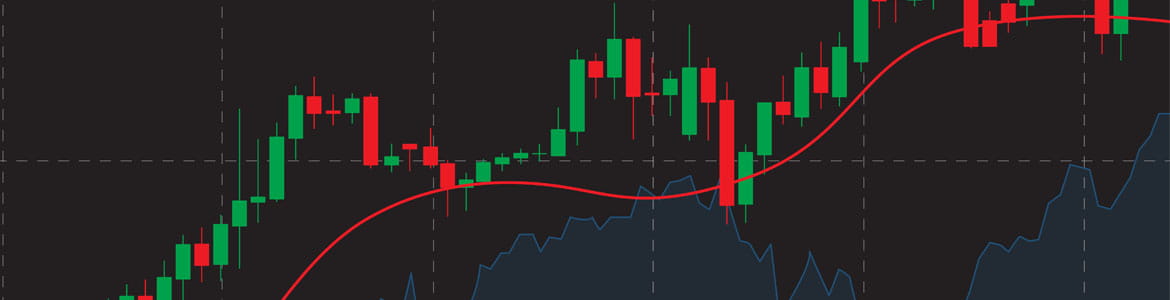
Nasdaq 100 technical analysis: NDX coiling above 12,900
From a technical perspective, the tech-heavy index has spent the last two weeks consolidating in a tight range around 13,000 after breaking out to 7-month highs late last month. Looking at the chart, the price action off the mid-March low looks like a “bullish flag” pattern, showing consolidation after a strong bullish move; if confirmed by a breakout above 13,200, this pattern would point to a strong bullish continuation toward previous resistance at 13,700 if not higher as we head into summer.

Source: TradingView, StoneX
While not the most likely scenario at the moment, a sustained bearish break back below 12,900 would point to a deteriorating outlook, especially if accompanied by poor earnings reports from the highly weighted Big Tech behemoths, and could portend a fall back toward the lower-12,000s.
-- Written by Matt Weller, Global Head of Research
Follow Matt on Twitter @MWellerFX
How to trade with City Index
You can trade with City Index by following these four easy steps:
-
Open an account, or log in if you’re already a customer
• Open an account in the UK
• Open an account in Australia
• Open an account in Singapore
- Search for the market you want to trade in our award-winning platform
- Choose your position and size, and your stop and limit levels
- Place the trade
Latest market news
Yesterday 01:32 PM
Yesterday 09:35 AM
Yesterday 07:23 AM
Yesterday 04:48 AM
Yesterday 12:17 AM
July 25, 2024 10:39 PM
Latest Nasdaq articles

Yesterday 01:32 PM

July 25, 2024 01:17 PM

July 25, 2024 01:01 AM

July 23, 2024 01:38 PM